| Previous Next Index Image Index Year Selection | |
|
|
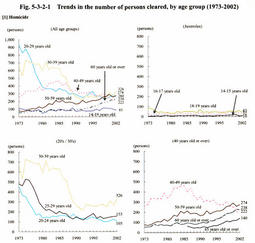
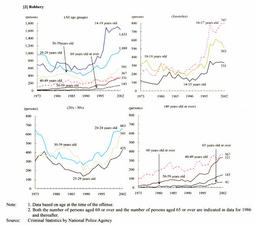
1 Trends by age group (increase in young offenders who have committed robbery) (1) Trends in the number of persons cleared Fig. 5-3-2-1 shows the number of persons cleared for homicide and robbery over the 30 years from 1973, by age group.
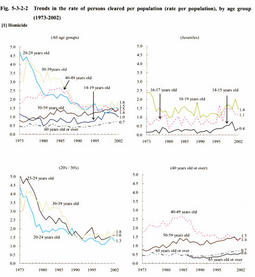
As for homicide, the numbers of young and middle-aged people in their 20s and 30s were larger in the initial period but declined rapidly since 1975 and 1985 respectively. The number of persons in their 40s has been decreasing gradually since 1985 whereas the numbers of persons in their 50s and 60s (including those aged 65 or over and generally regarded as "elderly people") have been increasing gradually since 1989. The number of juvenile offenders aged 14 to 19 has been very small, without fluctuation. Fig. 5-3-2-1 Trends in the number of persons cleared, by age group (1973-2002) (2) Trends in the rate of persons cleared per population (rate per population) Due to year-to-year fluctuation in the population of each age group, in order to correctly identify the trends in the crime rate by age group, it is necessary to examine the number of persons cleared per 100,000 persons in each age group in each year. Fig. 5-3-2-2 shows the number of persons cleared for homicide and robbery per 100,000 persons in each age group.
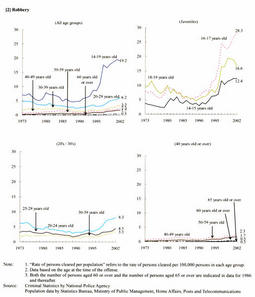
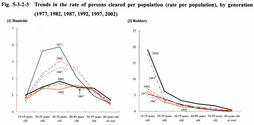
As for homicide, as the trends in the number of persons cleared, the rates per population among persons in their 20s and persons in their 30s, which had ranked highly, dropped sharply from 1975 and 1985 respectively and they have remained almost flat since 1989. On the other hand, the rate per population among juvenile offenders as well as the rates among elderly people in their 50s and 60s have been rising slightly. Despite the decreasing population of juveniles aged 14 to 19 due to the falling birthrate, the number of juvenile offenders aged 14-19 cleared has not declined but remained flat. For this reason, the rate per population among juvenile offenders aged 14-19 suggests a substantial increase in the number of juvenile offenders aged 14-19, though slightly (increasing by 0.2 points from 1995 to 2002). In the groups of elderly people, the increase in the rate per population is not so remarkable as that in the number of persons cleared. The increase in the number of elderly people cleared for homicide may be due to the rapid increase in the population of elderly people along with the aging of society as a whole. Fig. 5-3-2-2 Trends in the rate of persons cleared per population (rate per population), by age group (1973-2002) Among adults, the rate per population among persons aged 20-24 has been rising since 1996, increasing by 4.7 points from 1995 to 2002 and showing the same upward trend as the number of persons cleared in this age group. On the other hand, the rate per population among elderly people in their 50s and 60s has been increasing only slightly, which suggests that the remarkable rise in the number of elderly people cleared may be largely due to the increase in the population of elderly people. (3) Trends in generation gap Fig. 5-3-2-3 shows the trends in the rate per population by age group with respect to the number of persons cleared for homicide, robbery and general penal code offenses, for the purpose of examining the generation gap.
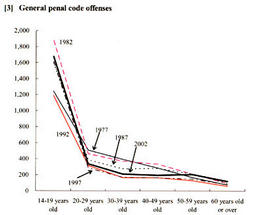
As for homicide, the rate per population was remarkably high among persons in their 20s and 30s around 1975, but such a remarkable projection has gradually leveled off from 1985 through to the Heisei era and the rate has been equalized for all age groups. In other words, the generation gap in the rate per population for homicide has been narrowing. As for robbery, the rate per population was relatively high among young people, and in particular juveniles, in the past. The rate per population among juveniles started to rise sharply in 1997, showing remarkably higher figures than those among other age groups. Thus, the generation gap in the rate per population for robbery has been further widening. As for general penal code offenses, the gap between age groups has been showing signs of expansion as the rate per population has been increasing only among juveniles from 1992 to 1997 and 2002. However, such expansion makes little difference from expansion over the period from 1977 to 1982 and therefore it is not a significant fluctuation like that seen for robbery. Thus, the trend in the generation gap seen for robbery does not correspond to the trend for general penal code offenses as a whole. Fig. 5-3-2-3 Trends in the rate of persons cleared per population (rate per population), by generation (1977, 1982, 1987, 1992, 1997, 2002) |