| Previous Next Index Image Index Year Selection | |
|
|
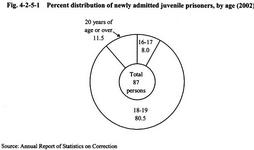
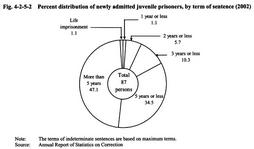
2 State of imprisonment and characteristics of juvenile prisoners The number of new juvenile prisoners since 1946 has generally shown a downward trend after hitting the last peak at 3,119 persons in 1951 when the age limit for the application of the current Juvenile Law was raised from under 18 to under 20, and it was 41 in 1996. After that, the number of new juvenile prisoners started to increase, and in 2002, it largely increased from 55 in the previous year to 87 (up 58% from the previous year), including 1 female. Fig. 4-2-5-1 shows the percent distribution of new juvenile prisoners in 2002 by age. There have been no large changes every year, and the newly convicted juvenile prisoners at 18 and 19 years of age stood at about 80%. Fig. 4-2-5-2 shows the percent distribution by term of sentence. 83 out of 87 new juvenile prisoners received an indeterminate sentence.
By type of sentence, all of the prisoners were sentenced to imprisonment with labor as with the previous year. By type of offense, 81 committed penal code offenses, while the other 6 committed special law offenses. The most common penal code offense was robbery-related offenses with 30 prisoners (2 prisoners for robbery, 24 for robbery resulting in death or bodily injury, and 4 for rape on the occasion of robbery or rape on the occasion of robbery resulting in death), followed by bodily injury-related offenses with 25 prisoners (24 prisoners for bodily injury resulting in death, and 1 for bodily injury), homicide with 7 prisoners, professional negligence resulting in death or bodily injury with 6 prisoners, and larceny with 6 prisoners. Fig. 4-2-5-1 Percent distribution of newly admitted juvenile prisoners, by age (2002) Fig. 4-2-5-2 Percent distribution of newly admitted juvenile prisoners, by term of sentence (2002) |