| Previous Next Index Image Index Year Selection | |
|
|
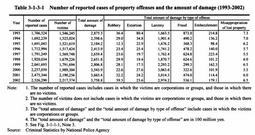
Table 3-1-3-1 shows the trends in the number of reported cases, the number of victims, and the total amount of property damage in property offenses (robbery, extortion, larceny, fraud, embezzlement and misappropriation of lost property) over the last 10 years since 1993.
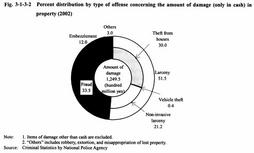
In 2002, the number of victims was 2,217,374 (an increase of 27,118, up 1.2% over the previous year), and the total amount of property damage was 375.88 billion yen (an increase of 9.34 billion yen, up 2.5%), both of which have continued to increase since 1996 or 1997. By type of offense, the amount of damage from larceny was 297.42 billion yen, accounting for about 80% of the total amount of damage, followed by fraud with 53.61 billion yen (14.3%), embezzlement with 17.91 billion yen (4.8%) in 2002. In recent years, the amount of damage from larceny had increased from 1996 to 2000, while that from other offenses had almost leveled of In 2001 and 2002, the amount of damage from larceny decreased, while that from robbery, fraud, and embezzlement increased. Table 3-1-3-1 Number of reported cases of property offenses and the amount of damage (1993-2002) Fig. 3-1-3-2 Percent distribution by type of offense concerning the amount of damage (only in cash) in property (2002) |