| Previous Next Index Image Index Year Selection | |
|
|
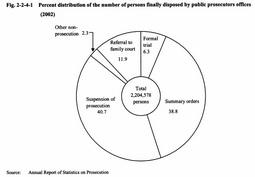
Fig. 2-2-4-1 shows the percent distribution of the number of persons finally disposed by public prosecutors offices in 2002.
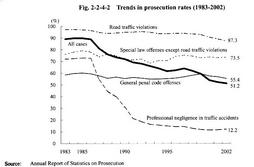
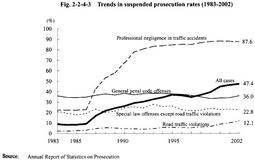
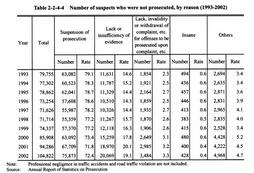
Fig. 2-2-4-1 Percent distribution of the number of persons finally disposed by public prosecutors offices (2002) In 2002, the number of persons finally disposed was 2,204,578. 139,480 persons (6.3% of the total) were prosecuted for formal trials, 855,270 (38.8%) were prosecuted for summary orders, 896,759 (40.7%) were granted suspension of prosecution, 50,345 (2.3%) were not prosecuted for other reasons, and 262,724 (11.9%) were referred to family courts (see Appendix 2-2 ).Fig. 2-2-4-2 and Fig. 2-2-4-3 show the trends in the prosecution rate and the suspended prosecution rate over the last 20 years from 1983, by type of offense. The prosecution rate was 51.2% and the suspended prosecution rate was 47.4% of all cases in 2002. The prosecution rate of all cases is on a downward trend while the suspended prosecution rate is on an upward trend. For general penal code offenses, the prosecution rate and the suspended prosecution rate have been within the range of 50% or over but below 60% and within the range of 30% or over but below 40% respectively, showing no notable changes (see Appendix 2-3 ). The real number of persons prosecuted for formal trials has increased for the last 8 years. It has continued to increase by 5% or more compared to the previous year since 1999 in particular (see Appendix 2-2 ). Fig. 2-2-4-2 Trends in prosecution rates (1983-2002) Fig. 2-2-4-3 Trends in suspended prosecution rates (1983-2002) Table 2-2-4-4 shows the trends in the number of suspects who were not prosecuted for offenses excluding professional negligence in traffic accidents and road traffic violations over the last 10 years, by reason for non-prosecution. In 2002 the number of suspects who were not prosecuted on the grounds of being granted suspension of prosecution increased by 8,164 from the previous year to 75,873 (72.4% of the total) while the number of suspects who were not prosecuted on the grounds of being insane increased by 28 from the previous year to 428 (0.4% of the total). In recent years, the percentage of non-prosecution due to suspension of prosecution has been slightly lower than before while the percentage of non-prosecution due to lack or insufficiency of evidence has been slightly higher.Table 2-2-4-4 Number of suspects who were not prosecuted, by reason (1993-2002) Explanation of termsQuasi-prosecution procedure: Under this system, the complainant or accuser who is dissatisfied with the non-prosecution disposition for abuse of authority of public officials decided by the public prosecutor can apply for committing the case to a court for trial. The court shall decide to commit the case for trial when the court considers it as appropriate, thereby a prosecusion is deemed to be instituted. This system is also called the system of application for committing a case to a court for trial. Prosecution rate: This is an indication of the following as a percentage: number of suspects prosecuted / (number of suspects prosecuted + number of suspects not prosecuted). The number of suspects prosecuted includes suspects prosecuted both for formal trials and for summary orders. Suspended prosecution rate: This is an indication of the following as a percentage: number of suspects granted suspension of prosecution / (number of suspects prosecuted + number of suspects granted suspension of prosecution). It does not include suspects who were not prosecuted for a reason other than suspension of prosecution, such as "insufficiency of evidence." The suspended prosecution rate shows what percentage of suspects were granted suspension of prosecution among those whose guilty were deemed sufficiently proved. |


