| Previous Next Index Image Index Year Selection | |
|
|
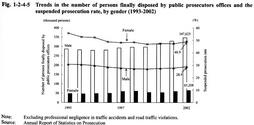
3 Treatment of female offenders (1) Disposition by public prosecutors offices Fig. 1-2-4-5 shows the trends in the number of persons finally disposed by public prosecutors offices and the suspended prosecution rate for offenses excluding professional negligence in traffic accidents and road traffic violations over the last 10 years, by gender. The suspended prosecution rate for male offenders has been around 30% whereas the rate for female offenders generally stayed over 50% until 1995 and declined slightly in 1996, hovering in the 45-50 % since then.
Fig. 1-2-4-5 Trends in the number of persons finally disposed by public prosecutors offices and the suspended prosecution rate, by gender (1993-2002) (2) Correction of female offenders Female offenders were imprisoned in 6 institutions, i.e. Tochigi, Kasamatsu, Wakayama, Iwakuni, and Fumoto Prisons and Sapporo Branch Prison. Although female inmates are not accommodated in separate institutions according to the classified categories for confinement (e.g. A Class inmates, B Class inmates, etc.) as in case of male offenders, these categories are taken into consideration in allocating female inmates to factories or rooms within the institutions.
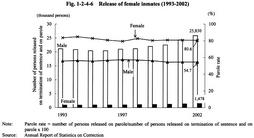
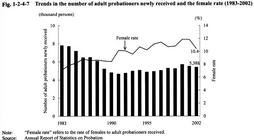
Female inmates are encouraged to take vocational training depending on their characteristics as well as correspondence courses and in-house educational courses. They also participate in club activities such as tanka, haiku, chorus, and flower arrangement (for the female rate and the percent distribution by gender/age group among new inmates, see Part 2, Chapter 4, Section 2 ). Fig. 1-2-4-6 shows the trends in the number of inmates released on termination of sentence or on parole and the parole rate over the last 10 years, by gender. The inmates released on termination of sentence or on parole have increased both for males and females whereas the parole rate has gone sideways. Fig. 1-2-4-6 Release of female inmates (1993-2002) (3) Probationary supervision for female offenders Fig. 1-2-4-7 shows the number of adult probationers newly received and the female rate (rate of females to adult probationers newly received) over the last 20 years. The female rate has been over 10% since 1994, marking 10.4% in 2002.
Fig. 1-2-4-7 Trends in the number of adult probationers newly received and the female rate (1983-2002) |


