| Previous Next Index Image Index Year Selection | |
|
|
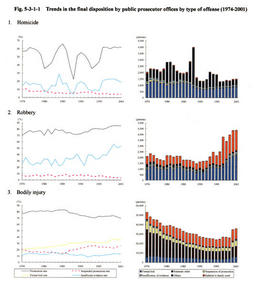
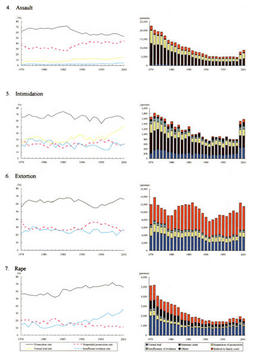
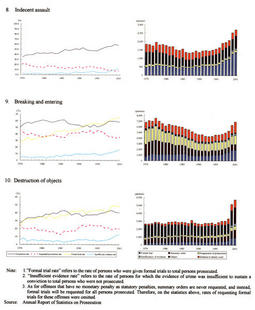
Fig. 5-3-1-1 shows the disposition by public prosecutors offices for homicide and the 9 types of violent offenses. The number of persons disposed by public prosecutors offices for homicide, which had generally exceeded 2,000 in the Showa era, has fallen below 2,000 and stayed around the range of 1,500 or over but below 1,600 in the Heisei era, with the exception of 1993. The number of persons disposed in 1988 was outstanding, which was because 2,441 persons who were not actually prosecuted due to a lack of evidence were included in the data. Among the 4,234 persons newly received in 1988 (including 2,028 persons reported or whose criminal complaints were directly received by public prosecutors), 2,283 persons were involved in cases where cases where multiple staff members of penal institutions were charged with and accused of attempted murder by a single inmate, but the essential facts constituting the crime were not discovered, and all of them, therefore, were not prosecuted because of a lack of evidence, etc. The prosecution rate of offenders, excluding these 2,283 persons, was 53. 1 % in 1988 (See Part 2, Chapter 2, Section 1 of the 1989 White Paper on Crime ). Prosecution rates have stayed at around 62% in the past few years, and suspended prosecution rates have hovered at around 4% since 1995.
The number of persons disposed by public prosecutors offices for robbery, which had stayed at around 2,000 until 1992, has almost consistently increased since 1993, exceeding 3,000 in 1997, 4,000 in 2000. In 2001, it reached 4,369. In conjunction with the increase in the number of persons disposed for robbery, the prosecution rate for robbery has risen, exceeding 80% since 1993 and 85% since 1999. Regarding extortion, which is comparatively similar to robbery in the nature of offense, the prosecution rate has been increasing and the suspended prosecution rate has been decreasing since 1997. In 2001, the prosecution rate for extortion was 85.2%. As for both robbery and extortion, along with the increase in the number of reported cases, the prosecution rates have increased and the suspended prosecution rates have decreased. Moreover, the number of cleared cases has increased along with the rise in the number of cases to be prosecuted. According to this information, it can be presumed that public prosecutors have disposed each case fairly after careful consideration. With respect to bodily injury, assault, intimidation, destruction of objects, and breaking and entering, the prosecution rates have been generally leveling off or moderately decreasing, and the suspended prosecution rates have been leveling off or moderately increasing. Overall, formal trial rates have increased (summary order rates have decreased), and more specifically, it has noticeably increased for intimidation, destruction of objects, and breaking and entering. As for the reasons behind this rise, it can be pointed out that the percent distribution of heinous offenses, for which formal trials should be requested, has increased along with the increase in the number of reported cases. Incidentally, concerning the cases where formal trials were requested for destruction of objects and breaking and entering, see 2 of Section 2 in this chapter . As for sexual offenses, the prosecution rate for rape, which had stayed within the range of 50% or over but below 60% until 1984, has exceeded 60% since 1985, and has been almost reaching 70% since 1996. The prosecution rate for indecent assault, which had continued rising annually and stayed within the range of 30% or over but below 40% from 1974 until 1980, reached the 40%-level in around 1975. It has exceeded 50% since 1989 except for 1991 through 1994, surpassing 60% in 2000. Incidentally, as for rape and indecent assault, the rate of offenders who were categorized as "others" in the prosecution disposition and were not prosecuted is higher than other offenses. This is because there are many cases where victims withdrew their complaints for the 2 offenses, which are marked by being subject to prosecution only following a complaint from victims. Fig. 5-3-1-1 Trends in the final disposition by public prosecutor offices by type of offense (1974-2001) |


