| Previous Next Index Image Index Year Selection | |
|
|
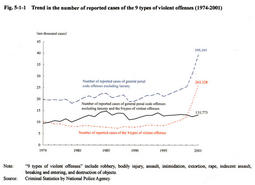
Fig. 5-1-1 shows the trend in the number of reported cases in respect of (i) general penal code offenses excluding larceny, (ii) 9 types of violent offenses in total; and (iii) general penal code offenses excluding larceny and the 9 types of violent offenses [(i)-(ii)].
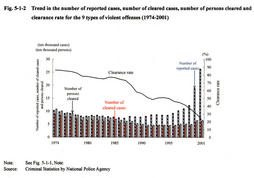
In Part 5, "general penal code offenses" refers to penal code offenses excluding professional negligence in traffic accidents. The number of reported cases of general penal code offenses excluding larceny had been at around the 200,000 level until 1995. The number started to steadily increase in 1996 and has been showing a rapid increase since 2000. On the other hand, the number of reported cases of general penal code offenses excluding larceny and the 9 types of violent offenses stayed within the range of 100,000 to 150,000, and it has been flat since 1996, without showing a trend of increase. Thus, it can be pointed out that the increase in the number of general penal code offenses excluding larceny since 1996 was due to the increase in the 9 types of violent offenses. The rate of increase over the previous year in the number of reported cases of the 9 types of violent offenses was generally lower than the rate of general penal code offenses excluding larceny since 1974, but it has always been above the rate for general penal code offenses excluding larceny since 1996. The rate of increase over the previous year for the 9 types of violent offenses was 52.6% in 2000 and 40.0% in 2001. Thus, the cause of the increase in the reported cases of general penal code offenses excluding larceny since 1996 was the increase in the 9 types of violent offenses. Fig. 5-1-2 shows the trends in the number of reported cases, the number of cleared cases, the number of persons cleared and the clearance rate for the 9 types of violent offenses. The clearance rate of the 9 types of violent offenses, which had remained at a high level since 1974, fell below the 60% mark in 1989. Since then, it has been declining steadily, falling below the 30% mark in 2001. In 2000 and 2001, the clearance rate dropped sharply over the previous year, despite the increase in the number of cleared cases and the number of persons cleared, which indicates that so many cases were reported that the police was unable to deal with all of them. Fig. 5-1-1 Trend in the number of reported cases of the 9 types of violent offenses (1974-2001) Fig. 5-1-2 Trend in the number of reported cases, number of cleared cases, number of persons cleared and clearance rate for the 9 types of violent offenses (1974-2001) |