| Previous Next Index Image Index Year Selection | |
|
|
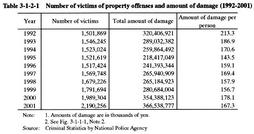
Table 3-1-2-1 shows the trends in the number of victims, the total amount of property damage and the amount of property damage per victim in property offenses (referring to, for the purpose of this Section, robbery, extortion, larceny, fraud, and embezzlement including misappropriation of lost property) reported by the police over the last 10 years since 1992.
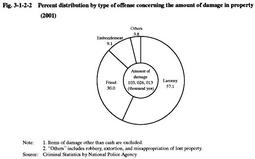
The number of victims took an upward turn in 1997. In 2001, it increased by 200,952 (10.1%) from the previous year. Table 3-1-2-1 Number of victims of property offenses and amount of damage (1992-2001) Fig. 3-1-2-2 Percent distribution by type of offense concerning the amount of damage in property (2001) |