| Previous Next Index Image Index Year Selection | |
|
|
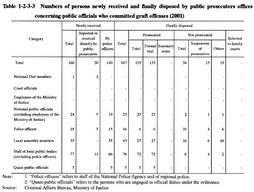
2 Graft and bribery Table 1-2-3-3 shows the number of public officials newly received and finally disposed by public prosecutors offices for graft offenses. The number of persons who were requested for formal trials was 133, the most of which 72 (54.1%) were officials of local public entities, followed by members of assemblies of local public entities with 27 (20.3%), and national public officials with 23 (17.3%).
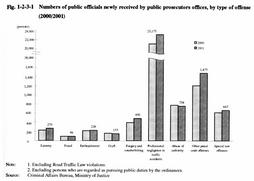
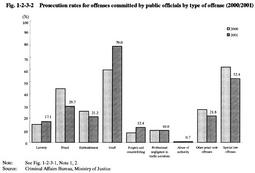
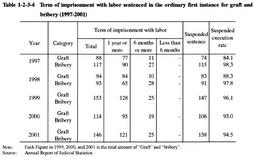
Table 1-2-3-4 shows the term of imprisonment with labor sentenced in the ordinary first instance for graft and bribery in the last 5 years from 1997 to 2001. In 2001, 8 public officials were sentenced to imprisonment with labor for a limited term without suspension of execution for graft and bribery (Source: Annual Report of Judicial Statistics). Fig. 1-2-3-1 Numbers of public officials newly received by public prosecutors offices, by type of offense (2000/2001) Fig. 1-2-3-2 Prosecution rates for offenses committed by public officials by type of offense (2000/2001) Table 1-2-3-3 Numbers of persons newly received and finally disposed by public prosecutors offices concerning public officials who committed graft offenses (2001) Table 1-2-3-4 Term of imprisonment with labor sentenced in the ordinary first instance for graft and bribery (1997-2001) |


