| Previous Next Index Image Index Year Selection | |
|
|
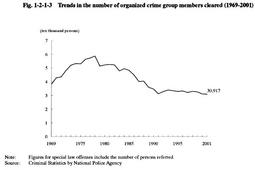
2 Trends in offenses by organized crime groups Fig. 1-2-1-3 shows the trends in the number of organized crime group members cleared for offenses other than professional negligence in traffic accidents and violations of traffic-related laws, such as Road Traffic Law violations since 1969. The number of organized crime group members cleared decreased from 40,401 in the previous year to 35,972 in 1989, and since then, it has stayed within the range of 30,000 or over but below 40,000. In 2001, it was 30,917, down by 137 (0.4%) from the previous year. Among them, 9,893 were regular members of organized crime groups, decreasing by 296 (2.9%) from the previous year.
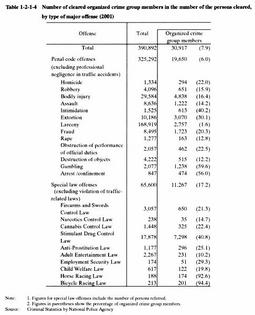
Regarding organized crime group members cleared in 2001, by penal code offenses and special law offenses, 19,650 (a decrease of 18 from the previous year) were for penal code offenses, and 11,267 (a decrease of 119 from the previous year) were for special law offenses. Moreover, in the percent distribution of organized crime group members who were cleared by type of offense, Stimulant Drug Control Law violations were the highest, numbering 23.6% (7,298 persons), followed by 15.6% (4,838 persons) for bodily injury, 9.9% (3,070 persons) for extortion, and 8.9% (2,757 persons) for larceny (Source:Criminal Investigation Bureau, National Police Agency). Table 1-2-1-4 shows the proportion of organized crime group members to the total persons cleared for penal code offenses and special law offenses in 2001, by type of major offense (see Part 5, Chapter 2, Section 4 ). Fig. 1-2-1-3 Trends in the number of organized crime group members cleared (1969-2001) Table 1-2-1-4 Number of cleared organized crime group members in the number of the persons cleared, by type of major offense (2001) |