| Previous Next Index Image Index Year Selection | |
|
|
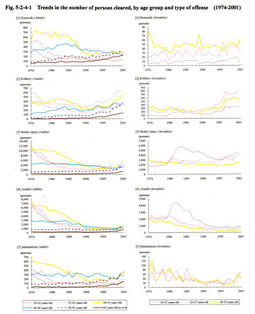
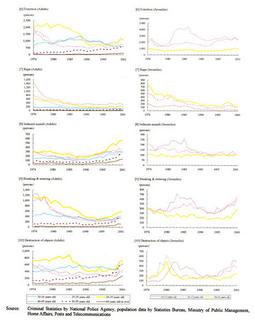
1 Trends by age group (1) Number of persons cleared, by age group Fig. 5-2-4-1 shows the trends in the numbers of adults and juveniles cleared for homicide and the 9 types of violent offenses, by age group. By type of offense, the rate of juveniles cleared was higher for robbery and extortion than that for other types of offense. By age group, it is characteristic that the number of teenagers cleared was large for homicide, intimidation, rape and indecent assault. In the case of adults in their 20s, the number of persons cleared was large for rape and indecent assault. In the age groups of adults in their 50s and adults in their 60s, the number of persons cleared has been showing an upward trend for all types of offense. In particular, during the period from 1974 to 2001, the number of persons cleared for robbery increased 12.7-fold in respect of adults in their 50s and 18.6-fold in respect of adults in their 60s. A significant increase is also seen in the number of persons cleared for indecent assaults in these age groups. The number of persons 50 years of age or over who were cleared for robbery and bodily injury has increased considerably in these years, which indicates drastic changes in the environment that surrounds elderly people.
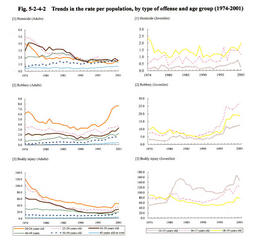
(2) Rate of person cleared per population (crime rate), by age group These increasing and decreasing trends by age groups may result from the imbalanced population composition that is indicated in declining birthrate and an aging population as well as in the large population of the baby-boom generation. In order to correct such an imbalance, the number of persons cleared per 100,000
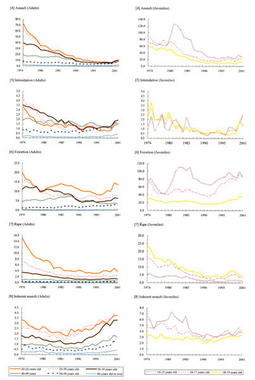
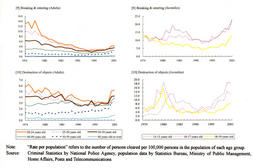
persons is calculated in each age group. This is hereinafter referred to as "crime rate" and its trends are shown in Fig. 5-2-4-2 . The overview of the trends of homicide and the 9 types of violent offenses indicates that the crime rate has also been on the rise in the age groups of adults in their 50s and adults in their 60s along with the increase in the number of persons cleared, and an outstanding upward trend has been seen especially in the past few years. Accordingly, it is pointed out that the increase in the number of persons cleared in their 50s or over was not only due to the large population of the baby-boom generation but also caused by the increase both in the actual number of persons cleared and the crime rate. This indicates the advancement of the aging of those who commit homicide and the 9 types of violent offenses. Fig. 5-2-4-1 Trends in the number of persons cleared, by age group and type of offense (1974-2001) (3) Trends of offenses by juveniles It is indicated that the crime rate for each age group of juveniles has recently been higher than that for each age group of adults in respect of offenses other than homicide, intimidation, rape and indecent assault.
By age group of juveniles, the trends of juvenile delinquency are generally characterized by lower crime rates for older age groups. However, completely different trends are seen in respect of homicide and the 9 types of violent offenses. In 2001, the crime rate was high for the 6 offenses (bodily injury, assault, intimidation, extortion, breaking and entering, and destruction of objects) in the age group of junior juveniles. On the other hand, the crime rate was high for robbery and indecent assault in the age group of intermediate juveniles and for homicide and rape in the age group of senior juveniles. Fig. 5-2-4-2 Trends in the rate per population, by type of offense and age group (1974-2001) |