Section 4 Result of the Survey (Theft offenders)
This section compares theft offenders, by male/female and by age, to clarify the characteristic trends of elderly female theft offenders.
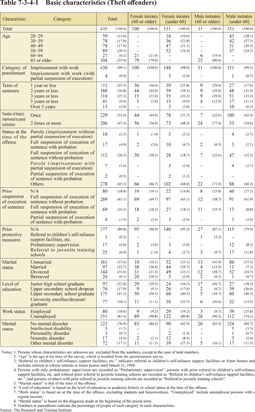
Table 7-3-4-1 shows the category of punishment, term of sentence, number of times imprisoned to penal institutions, etc. for theft offenders, by male/female and age.
Table 7-3-4-1 Basic characteristics (Theft offenders)
Click here for the Excel file (Japanese)
57.7% of female inmates on this survey committed theft offenses, and 95.9% of female inmates aged 60 or older committed shoplifting as their method of theft.
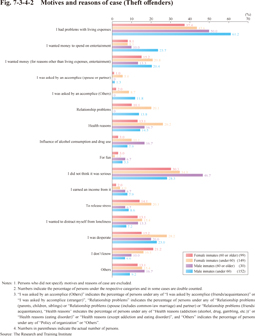
Fig. 7-3-4-2 shows the motives and reasons of the case of theft offenders, by male/female and age (numbers in some cases are double counted). The highest percentage of female theft offenders aged 60 or older answered “I had problems with living expenses”, accounting for only 37.4%, which is lower than that of males, and females under 60 years of age.
Fig. 7-3-4-2 Motives and reasons of case (Theft offenders)
Click here for the Excel file (Japanese)
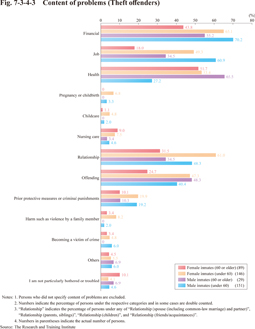
Fig. 7-3-4-3 shows the content of problems and concerns in the year immediately before physical custody such as arrest, by male/female and age (numbers in some cases are double counted). The percentage of female theft offenders aged 60 or older answered “financial”, accounting for only 43.8%, which is lower than that of males, and females under 60 years of age.
These percentages suggest that some female theft offenders aged 60 or older had been committing the crime even though there was no imminent need.
Fig. 7-3-4-3 Content of problems (Theft offenders)
Click here for the Excel file (Japanese)
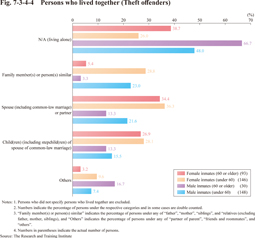
Fig. 7-3-4-4 shows the persons who lived together in the year immediately before physical custody such as arrest, by male/female and age (numbers in some cases are double counted). The highest percentage of female theft offenders aged 60 or older answered living alone.
Fig. 7-3-4-4 Persons who lived together (Theft offenders)
Click here for the Excel file (Japanese)
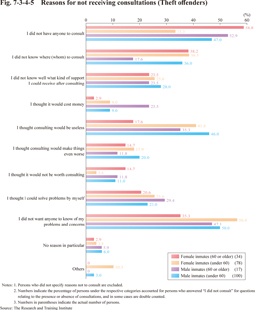
Fig. 7-3-4-5 shows the reasons for not consulting about problems and concerns, by male/female and age (numbers in some cases are double counted). This was asked as a follow-up question to persons who answered they did not consult with anybody in all categories in Fig. 7-3-4-3, excluding persons who answered “I am not particularly bothered or troubled”. 58.8% of female theft offenders aged 60 or older answered “I did not have anyone to consult”, and 17.6% answered “I thought it would not be worth consulting”.
These percentages suggest that isolated situations were behind the theft offenses committed by female inmates aged 60 or older, who had the desire to consult with someone but were unable to do so.
Fig. 7-3-4-5 Reasons for not receiving consultations (Theft offenders)
