Section 2 Reimprisonment of released inmates
Fig. 5-3-2-1 shows the percentages of cumulated numbers of reimprisoned inmates within the period of five or 10 years after the release from prison in 2006 or 2011 among the released inmates of a given year (hereinafter “percentages of reimprisonment”, by reasons for the previous release (either released on completion of the term or released on parole).
Fig. 5-3-2-1 Percentages of reimprisonment of released inmates, by reasons for the previous release
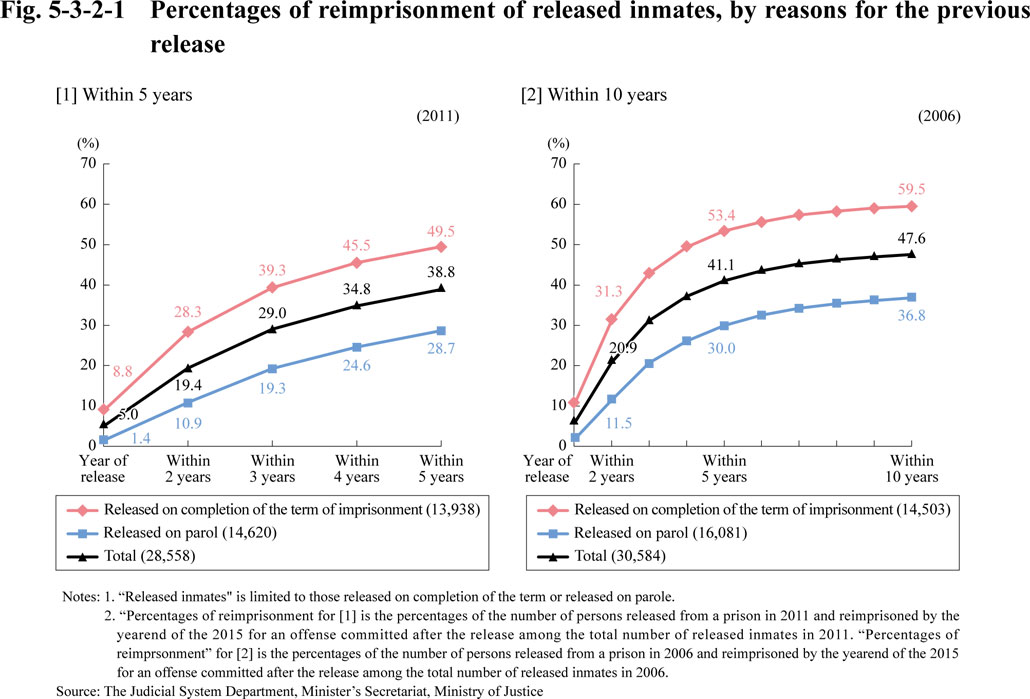
Fig. 5-3-2-2 Percentages of reimprisonment of released inmates, by the number of time(s) imprisoned
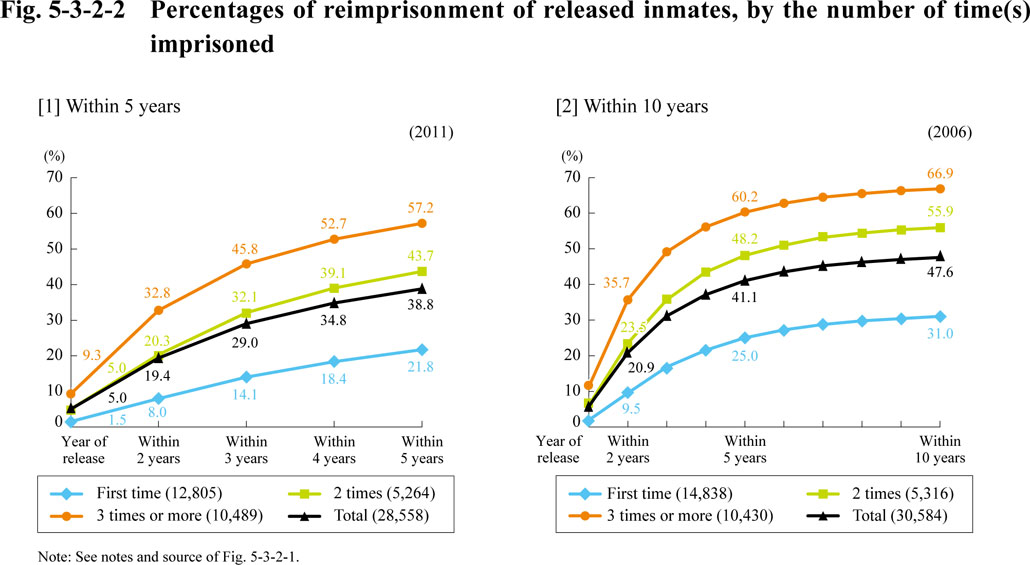
Fig. 5-3-2-3 shows the percentages of reimprisonment of released inmates, by types of offense.
Fig. 5-3-2-3 Percentages of reimprisonment within 5 years after the release, by reasons for the previous release, by types of offense
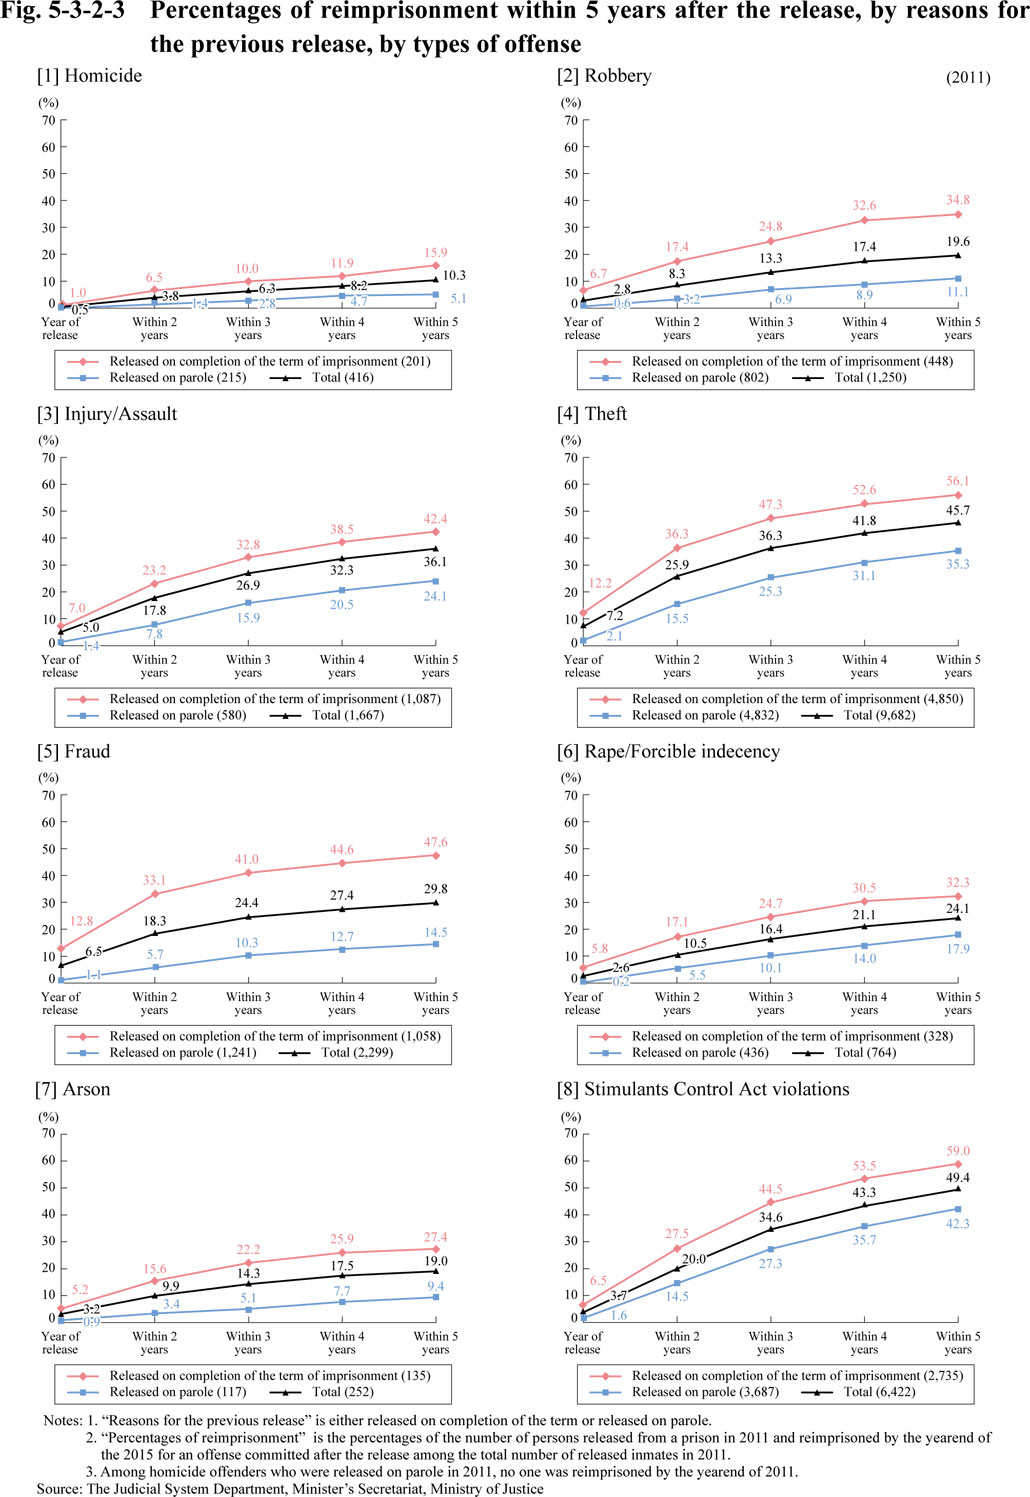
Fig. 5-3-2-4 shows the trends of percentage of reimprisonment within the period of [1] two years, [2] five years or [3]10 years after the release, by the reasons for the previous release.
Fig. 5-3-2-4 Percentages of reimprisonment of released inmates, by reasons for the previous release
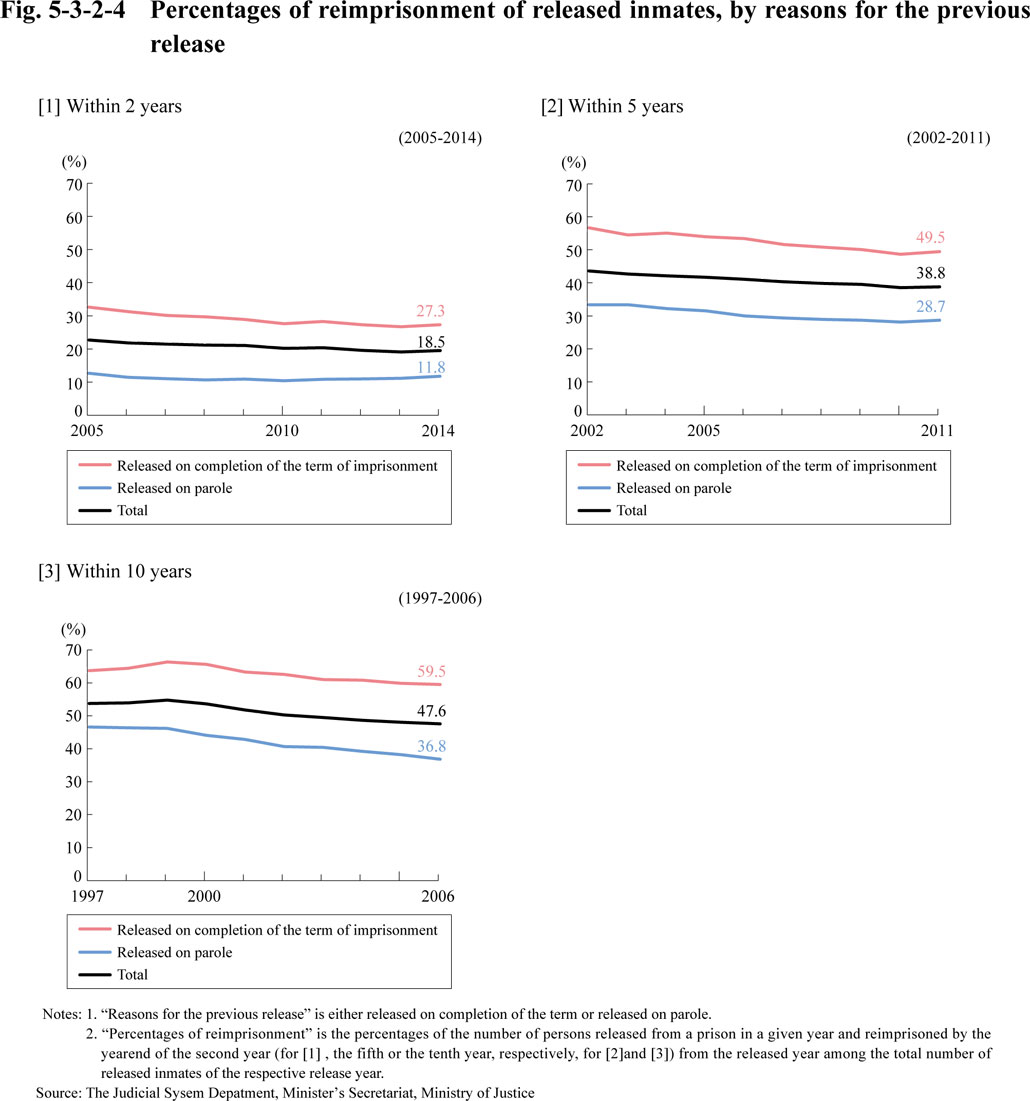
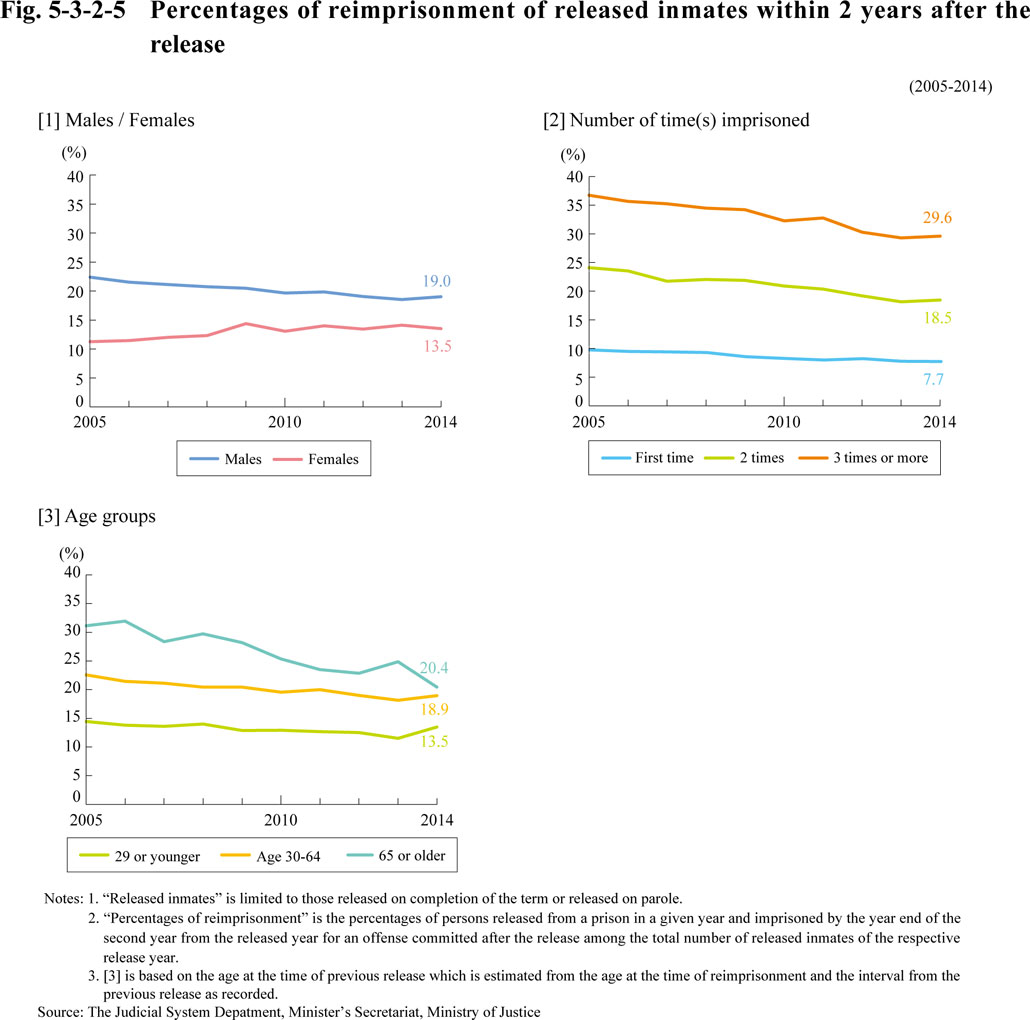
Fig. 5-3-2-5 shows the trends of percentage of reimprisonment within the period of two years after the release, [1] by males/females, [2] by the number of time(s) they had been imprisoned at the point of previous imprisonment, and [3] by age groups.
Fig. 5-3-2-5 Percentages of reimprisonment of released inmates within 2 years after the release