1 Probationers and parolees
(1) Number of persons newly placed under probation and parole supervision
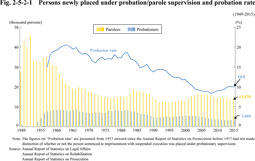
Fig. 2-5-2-1 shows the number of persons newly placed under probation/parole supervision since 1949 and the probation rate among those granted suspension of execution of their sentences (See Appendix 2-7).
Fig. 2-5-2-1 Persons newly placed under probation/parole supervision and probation rate
(2) Age of probationers and parolees
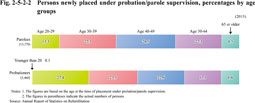
Fig. 2-5-2-2 shows the percentages of persons newly placed under probation/parole supervision, by age groups in 2015.
Fig. 2-5-2-2 Persons newly placed under probation/parole supervision, percentages by age groups
(3) Types of offenses
For the percentages of persons newly placed under probation/parole supervision by types of offense, see Appendix 2-8.

