PART 1 Crime Trends
Chapter 1 Penal Code Offenses
Section 1 Principal Data
Fig. 1-1-1-1 shows the trends of reported cases, persons cleared and clearance rate for Penal Code offenses since 1946 (See Appendix 1-1).
Fig. 1-1-1-1 Penal Code offenses: reported cases, cleared persons and clearance rate
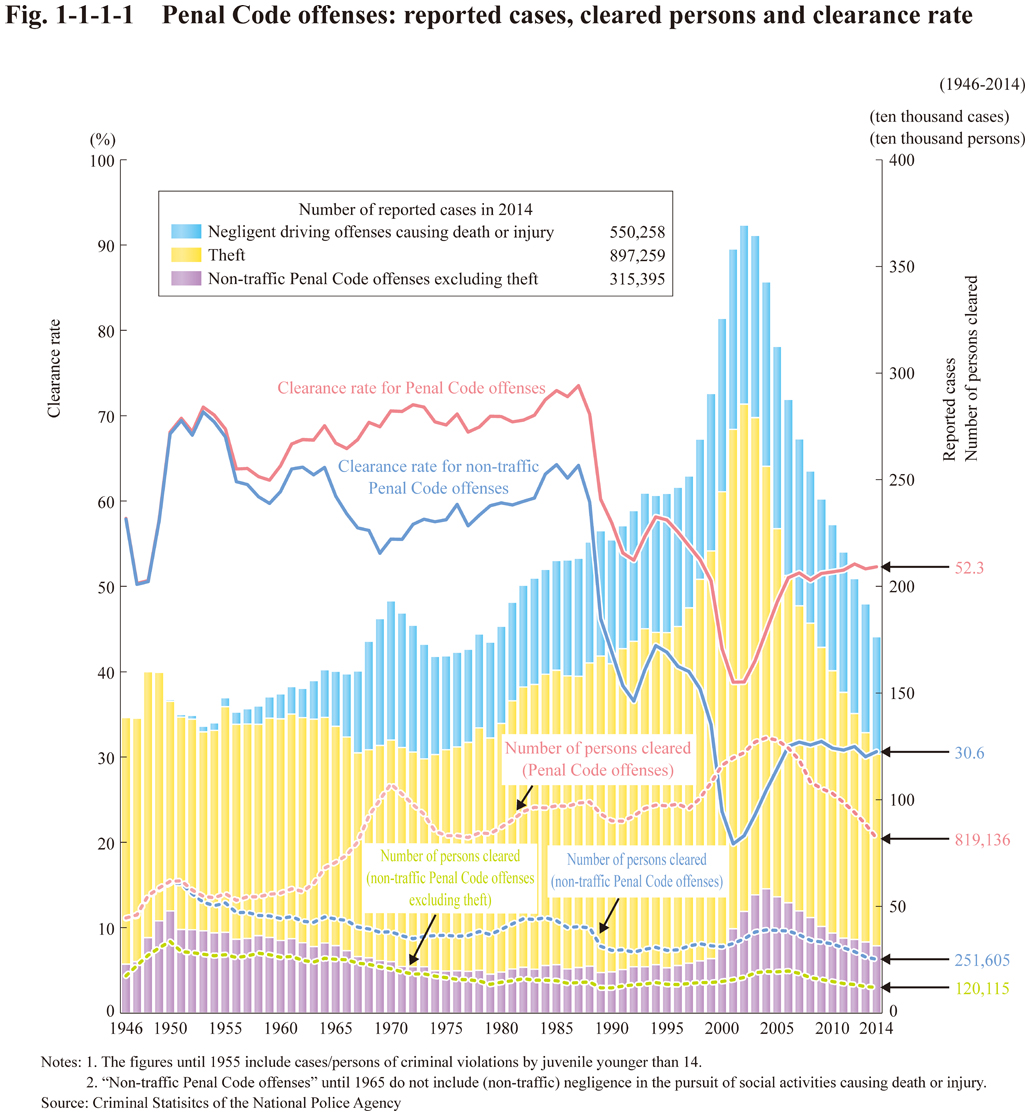
The crime rate for Penal Code offenses follows similar trend as of the number of reported cases (See Appendix 1-1).
Fig. 1-1-1-2 shows persons cleared for non-traffic Penal Code offenses in percentages by age groups.
Fig. 1-1-1-2 Non-traffic Penal Code offenses: cleared persons (percentages by age groups)
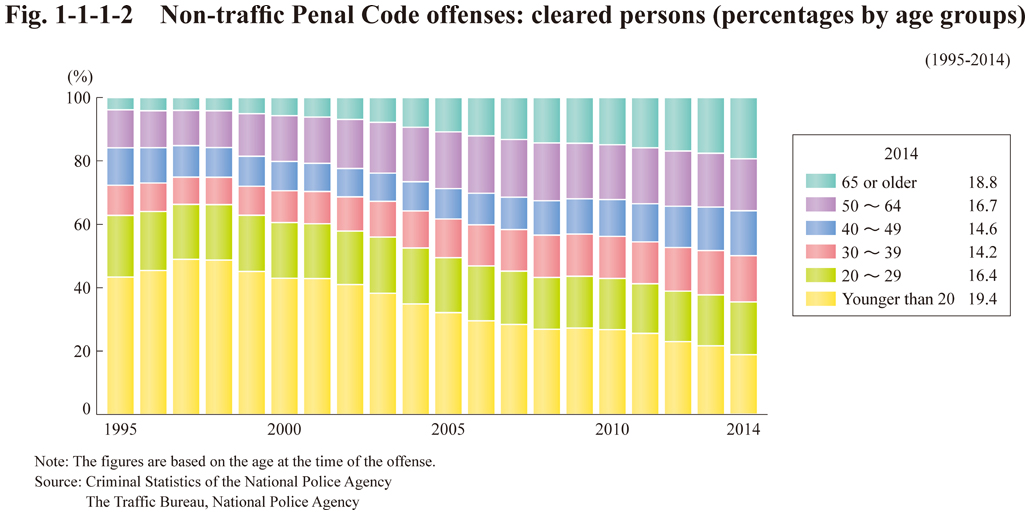
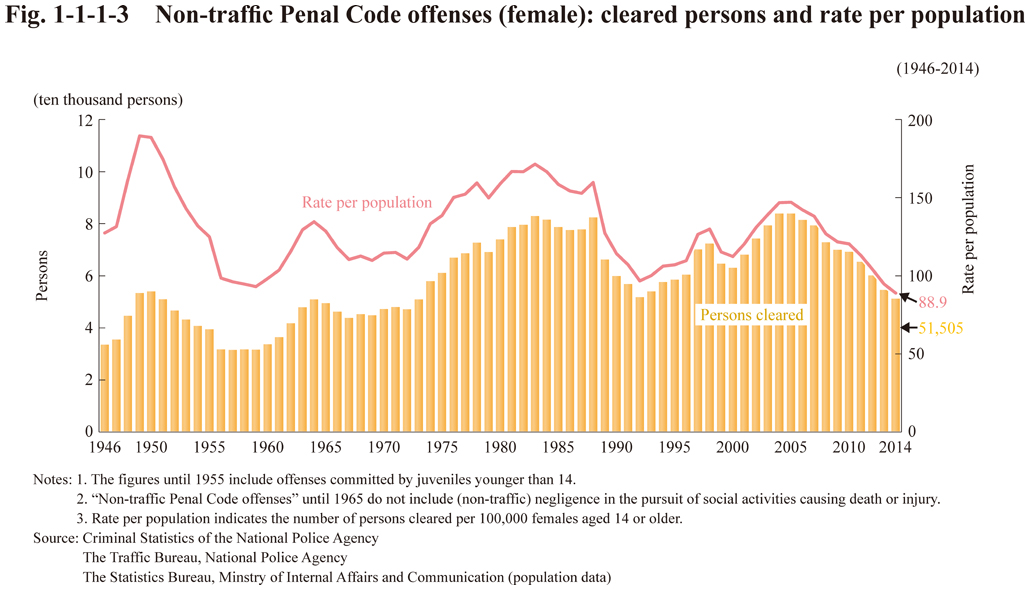
Fig. 1-1-1-3 shows the trend of females cleared for non-traffic Penal Code offense ssince 1946 (See Appendix 1-1).
Fig. 1-1-1-3 Non-traffic Penal Code offenses (female): cleared persons and rate per population