Chapter 5 Elderly Offenders
Section 1 Trends in Offenses
Fig. 4-5-1-1 shows the number of persons cleared for non-traffic Penal Code offenses by age group.
Fig. 4-5-1-1 Number of persons cleared for non-traffic Penal Code offenses by age group (1994-2013)
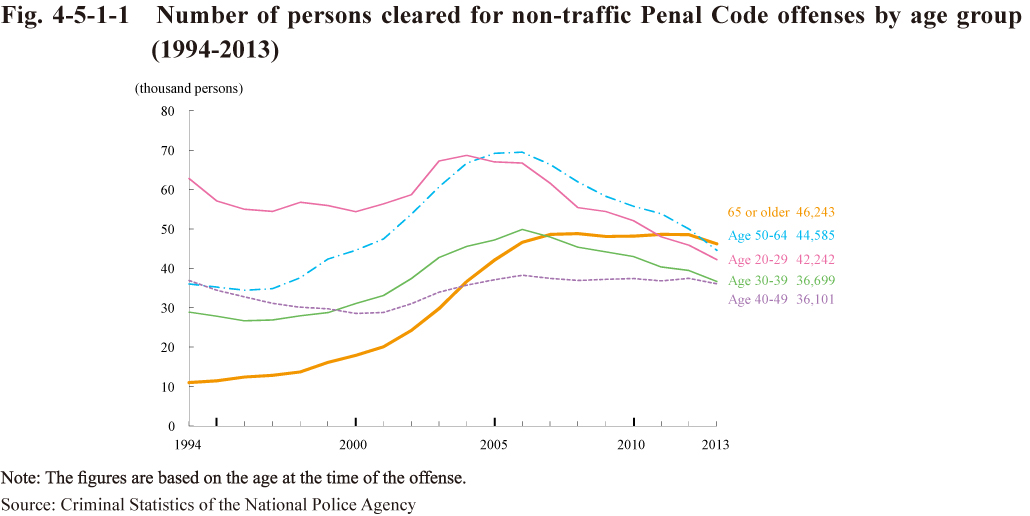
Fig. 4-5-1-2 shows the rate per population of persons cleared for non-traffic Penal Code offenses by age group.
Fig. 4-5-1-2 Rate per population of persons cleared for non-traffic Penal Code offenses by age group (1994-2013)
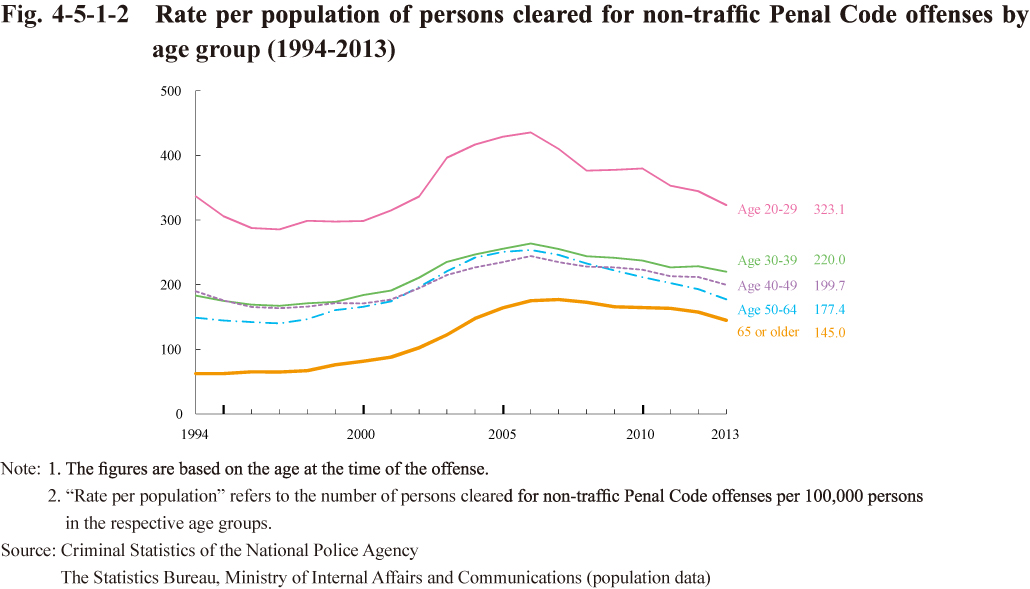
Fig. 4-5-1-3 shows the percent distribution of elderly persons cleared for non-traffic Penal Code offenses by gender and type of offense in 2013.
Fig. 4-5-1-3 Percent distribution of elderly persons cleared for non-traffic Penal Code offenses by gender and type of offense (2013)
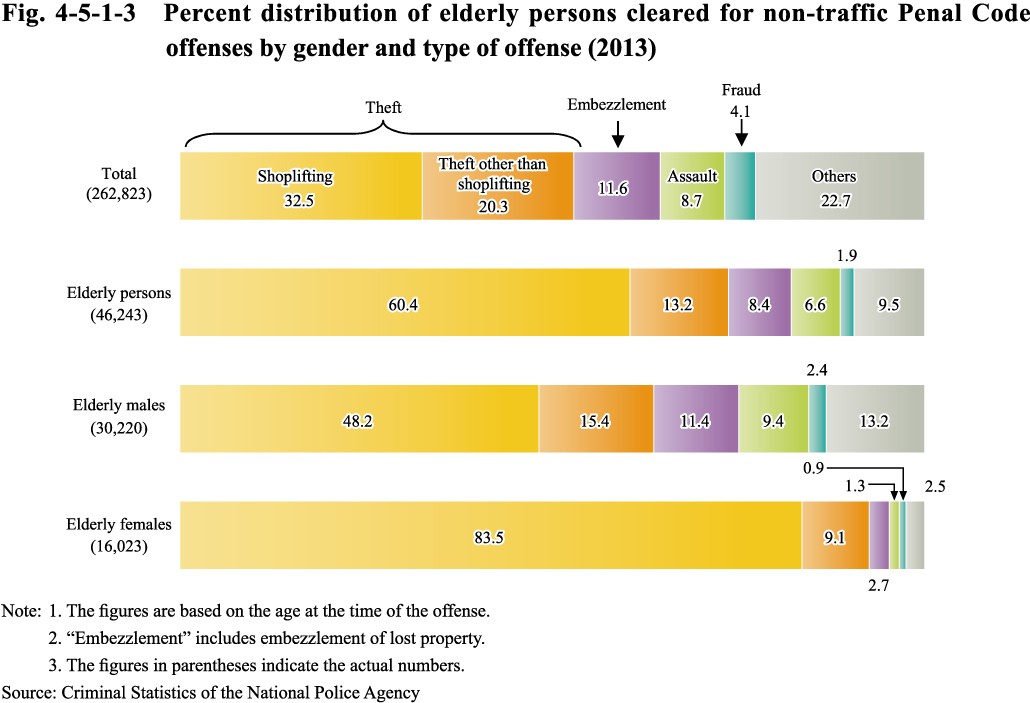
Fig. 4-5-1-4 shows the number of elderly persons cleared for several Penal Code offenses.
Fig. 4-5-1-4 Number of elderly persons cleared by type of offense (1994-2013)
