1 Number of probationers and parolees
(1) Number of persons newly placed under probation and parole supervision
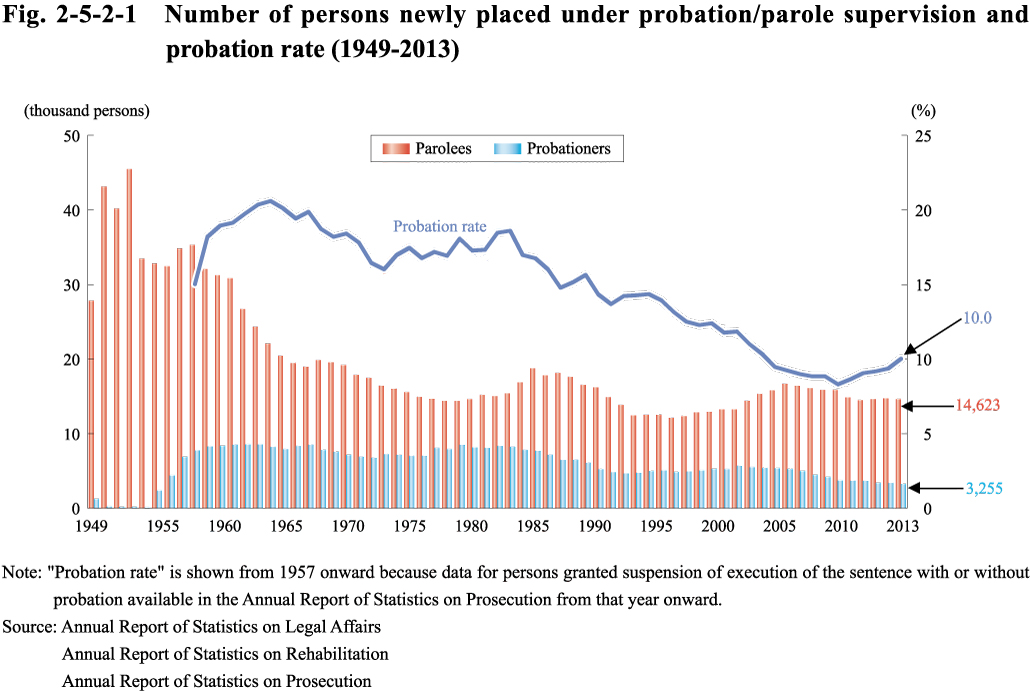
Fig. 2-5-2-1 shows the number of persons newly placed under probation/parole supervision since 1949 and the probation rate. See also Appendix 2-12.
Fig. 2-5-2-1 Number of persons newly placed under probation/parole supervision and probation rate (1949-2013)
(2) Characteristics of probationers and parolees
A. Age
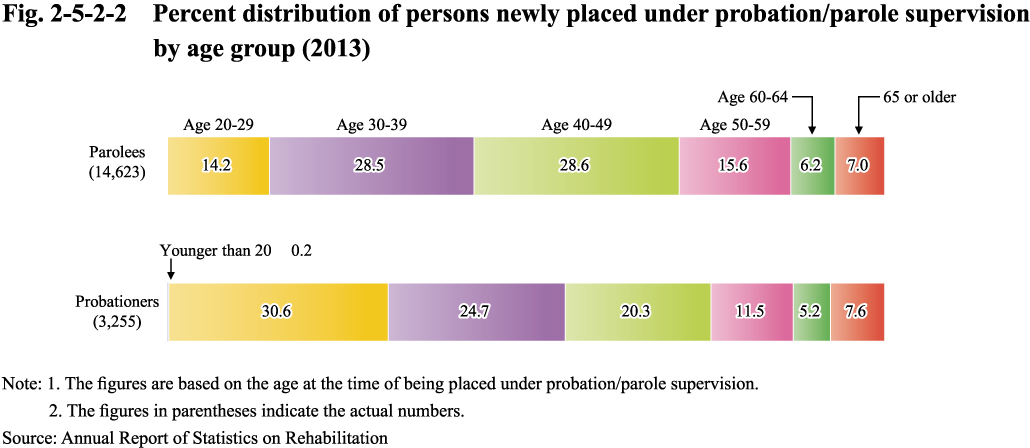
Fig. 2-5-2-2 shows the percent distribution of persons newly placed under probation/parole supervision by age group in 2013.
Fig. 2-5-2-2 Percent distribution of persons newly placed under probation/parole supervision by age group (2013)
B. Type of offense
For the percent distribution of persons newly placed under probation/parole supervision by type of offense, see Appendix 2-13
.