3 Characteristics of new inmates
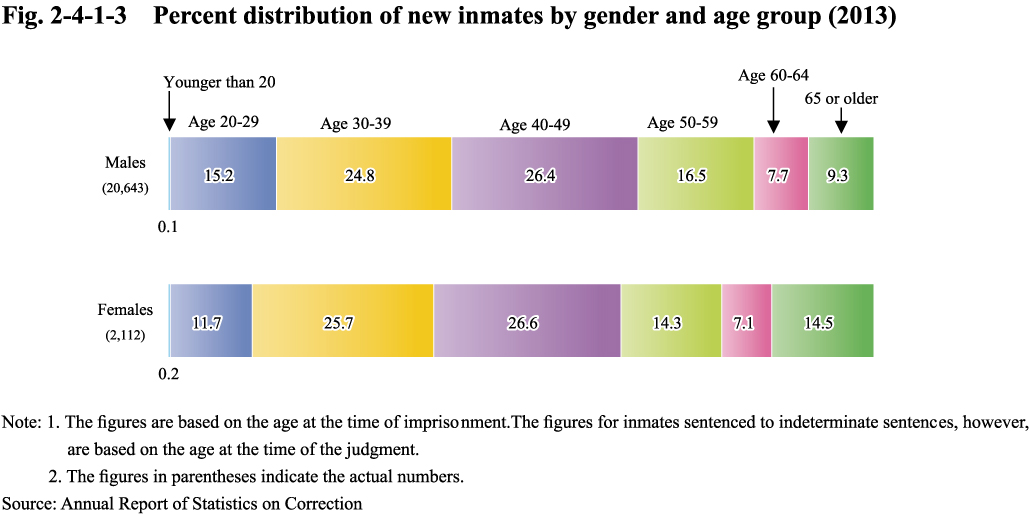
(1) Age
Fig. 2-4-1-3 shows the percentage of new inmates in 2013 by gender and age group.
Fig. 2-4-1-3 Percent distribution of new inmates by gender and age group (2013)
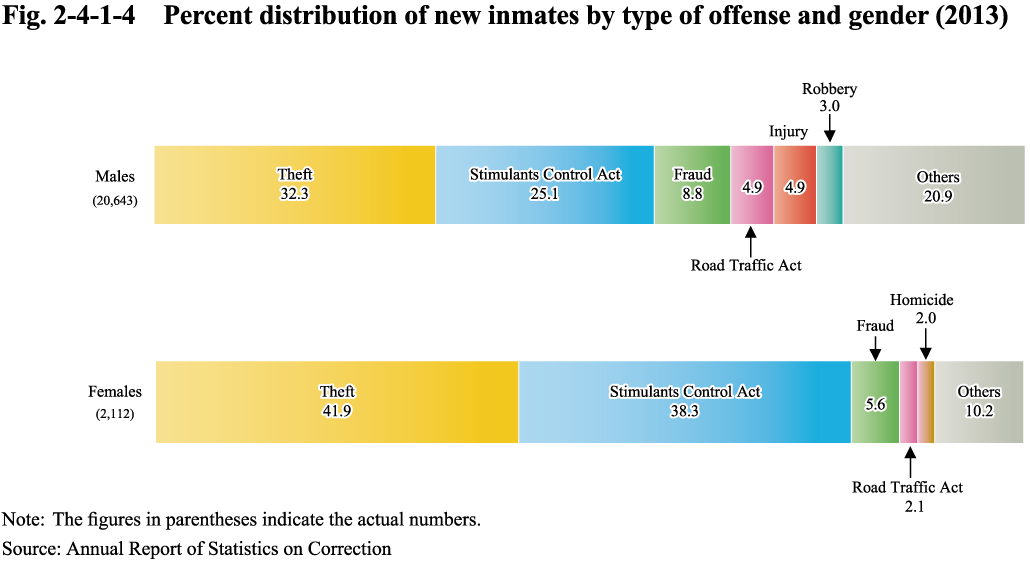
(2) Type of offense
Fig. 2-4-1-4 shows the percentage of new inmates in 2013 by type of offense and gender.(See Appendix 2-6)
Fig. 2-4-1-4 Percent distribution of new inmates by type of offense and gender (2013)
(3) Term of imprisonment
See Appendix 2-10 for the number of inmates sentenced to imprisonment as of the end of the respective year by the term of imprisonment.