Section 2 Disposition
Fig. 2-2-2-1[1] shows the percentage of persons whose cases were disposed of by public prosecutors (including juvenile cases) by type of disposition, and [2] shows number of persons indicted, and the indictment rate (See Appendix 2-2).
Fig. 2-2-2-1 Percent distribution of persons whose cases conclusively disposed of by public prosecutors by type of disposition and number of persons indicted (2003-2012)
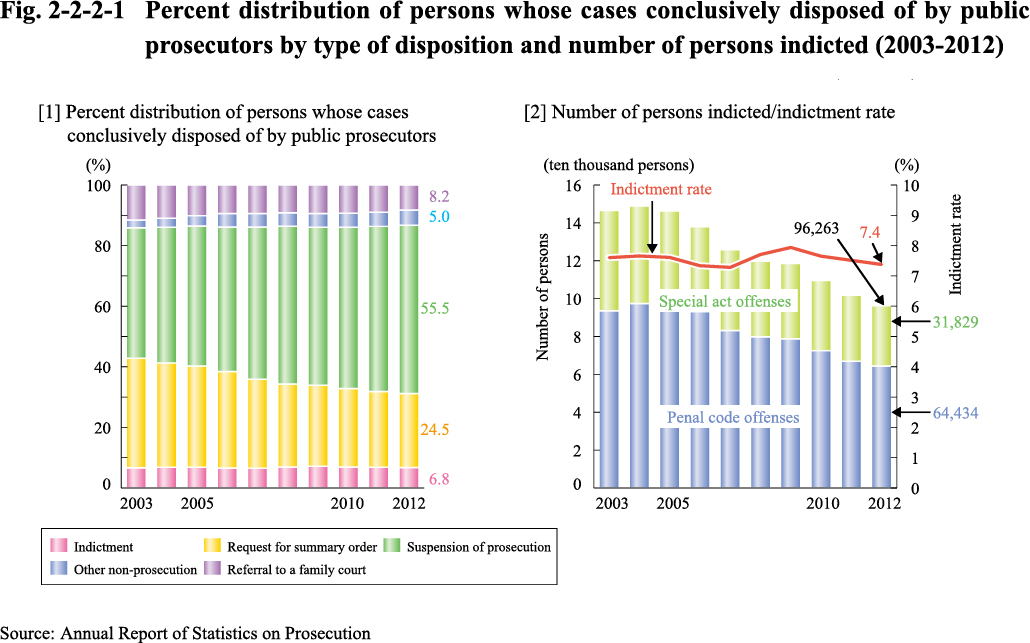
Fig. 2-2-2-2 shows the number of persons whose cases were disposed of by the public prosecutor and the disposition with respect to different types of offense (See Appendix 2-3).
Fig. 2-2-2-2 Number of persons prosecuted, not prosecuted, etc. by type of offense (2003-2012)
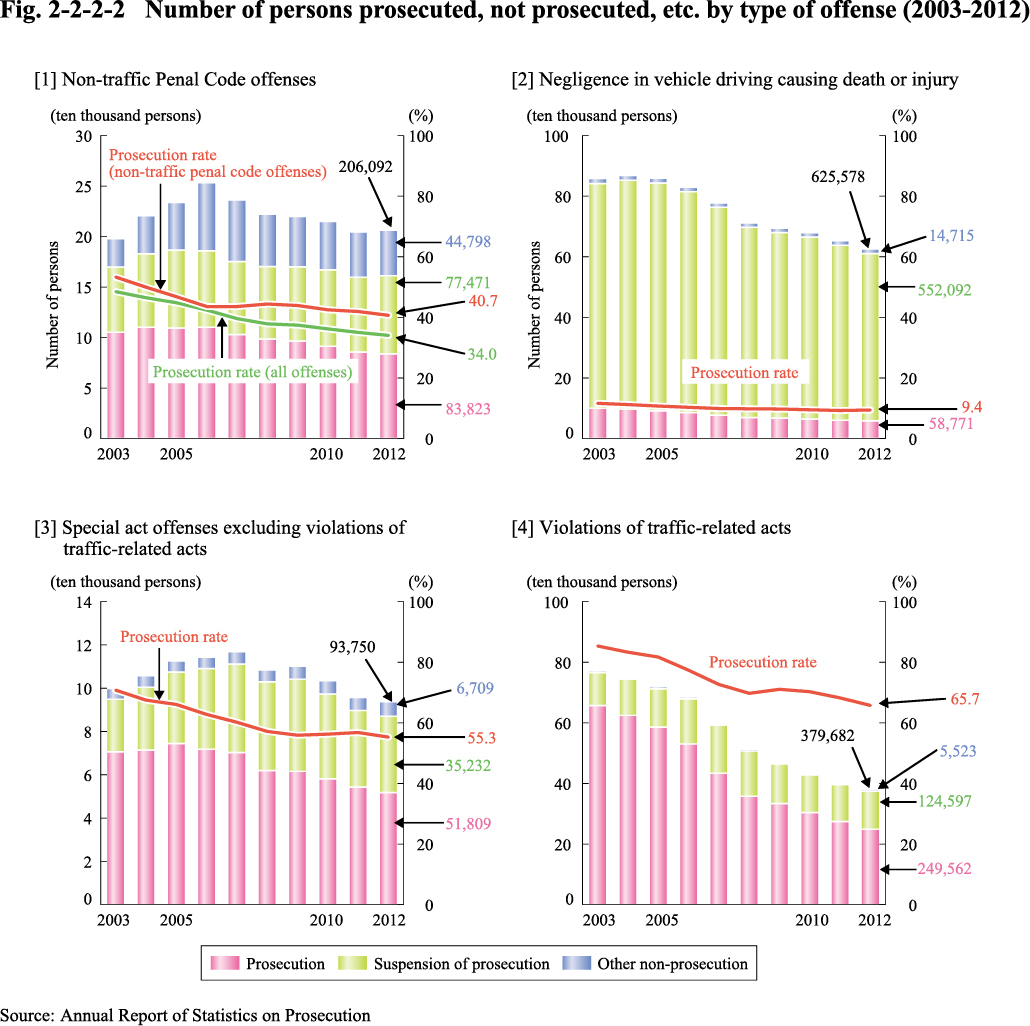
Table 2-2-2-3 shows the number of persons not prosecuted by reason (limited to those disposed for non-traffic penal code offenses and special act offenses excluding violations of traffic-related acts).
Table 2-2-2-3 Number of persons not prosecuted by reason (2012)
