PART 1 Crime Trends
Chapter 1 Penal Code Offenses
Section 1 Principal Data
Fig. 1-1-1-1 shows the number of reported cases, number of persons cleared and clearance rate for Penal Code offenses (See Appendix 1-1).
Fig. 1-1-1-1 Number of reported cases, persons cleared and clearance rate for Penal Code offenses (1946-2012)

The crime rate (i.e., number of reported cases per 100,000 inhabitants) for Penal Code offenses basically followed the same trend as the number of reported cases. (See Appendix 1-1).
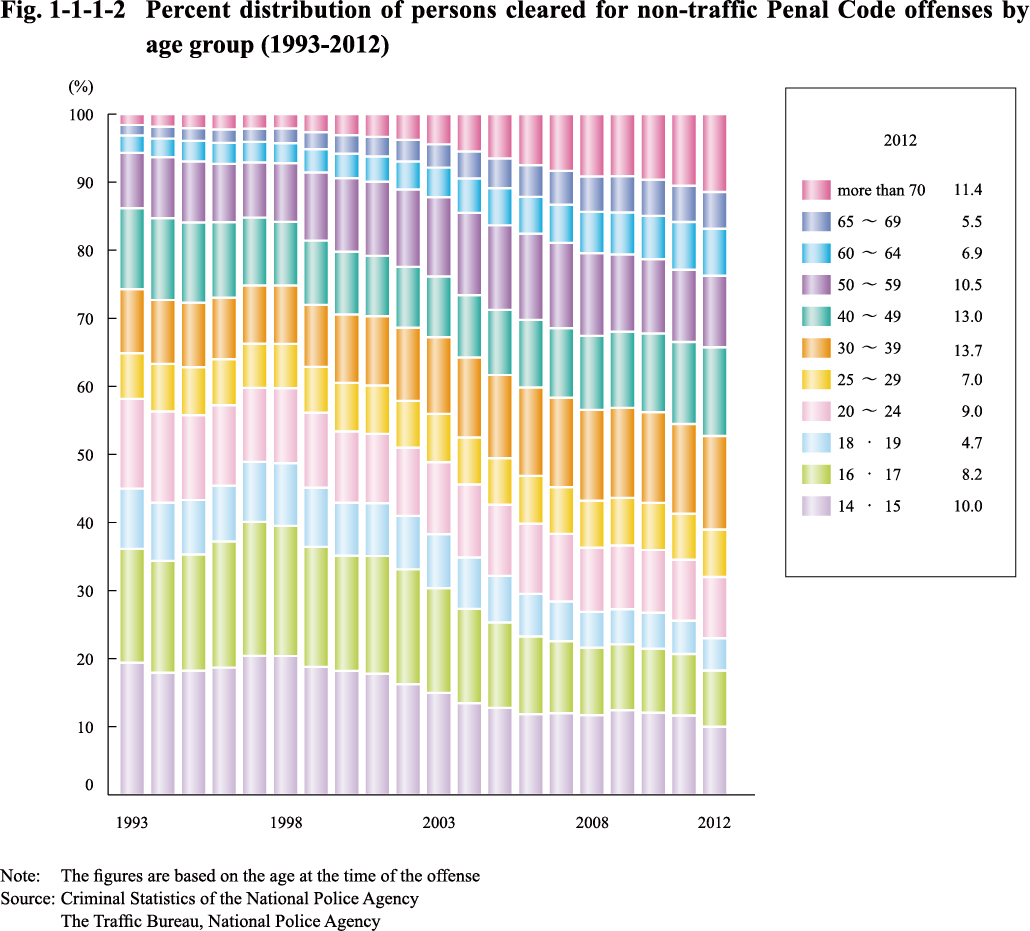
Fig. 1-1-1-2 shows the percent distribution of persons cleared for non-traffic Penal Code offenses by age group (See the Appendix for females).
Fig. 1-1-1-2 Percent distribution of persons cleared for non-traffic Penal Code offenses by age group (1993-2012)