2 Actual situation with crime victims
(1) Victim rate by victimization type
Fig. 5-3-2-1 shows the victim rate (refers to the percentage of persons who have been victimized at least once; hereinafter the same in this subsection) of subject crimes by victimization type over the last five years (refers to the five-year period prior to the year of the survey and the period between the beginning of the year of the survey and the actual date of the survey; hereinafter the same in this subsection) and in 2011.
The percentage of respondents who had suffered any subject crimes (refers to household crime victims and individual crime victims in the survey; hereinafter the same in this subsection) was 34.4% over the last five years and 11.9% in 2011. Of household crime victims, bicycle theft had the highest rate, followed by damage to motor vehicles. The victim rate over the last five years and in 2011 was generally lower with individual crime victims and various fraud victims than with household crime victims. With billing fraud, the survey was also conducted, in addition to the existence of the crime victims, concerning the experience of having received telephone calls, e-mail, or notifications, etc. deemed to be billing fraud. The percentage of those that received such telephone calls, etc. over the last five years accounted for 20.1% (victims that actually paid some money after having received a telephone call, etc. were indicated as the victim rate of “billing fraud” in the same Fig.).
Fig. 5-3-2-1 Victim rate by victimization type over the last 5 years and in 2011 (2012 survey)
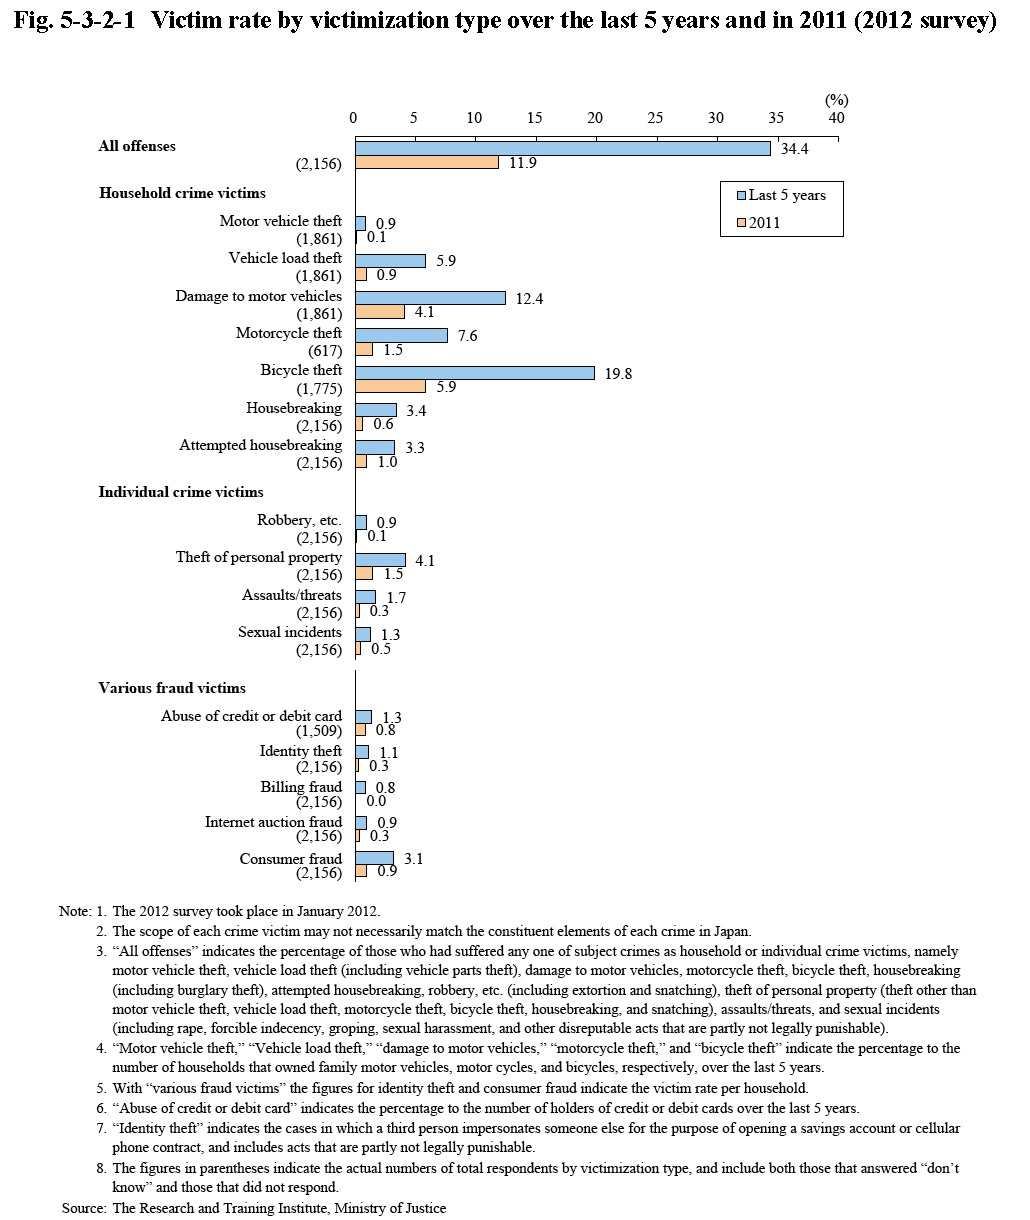
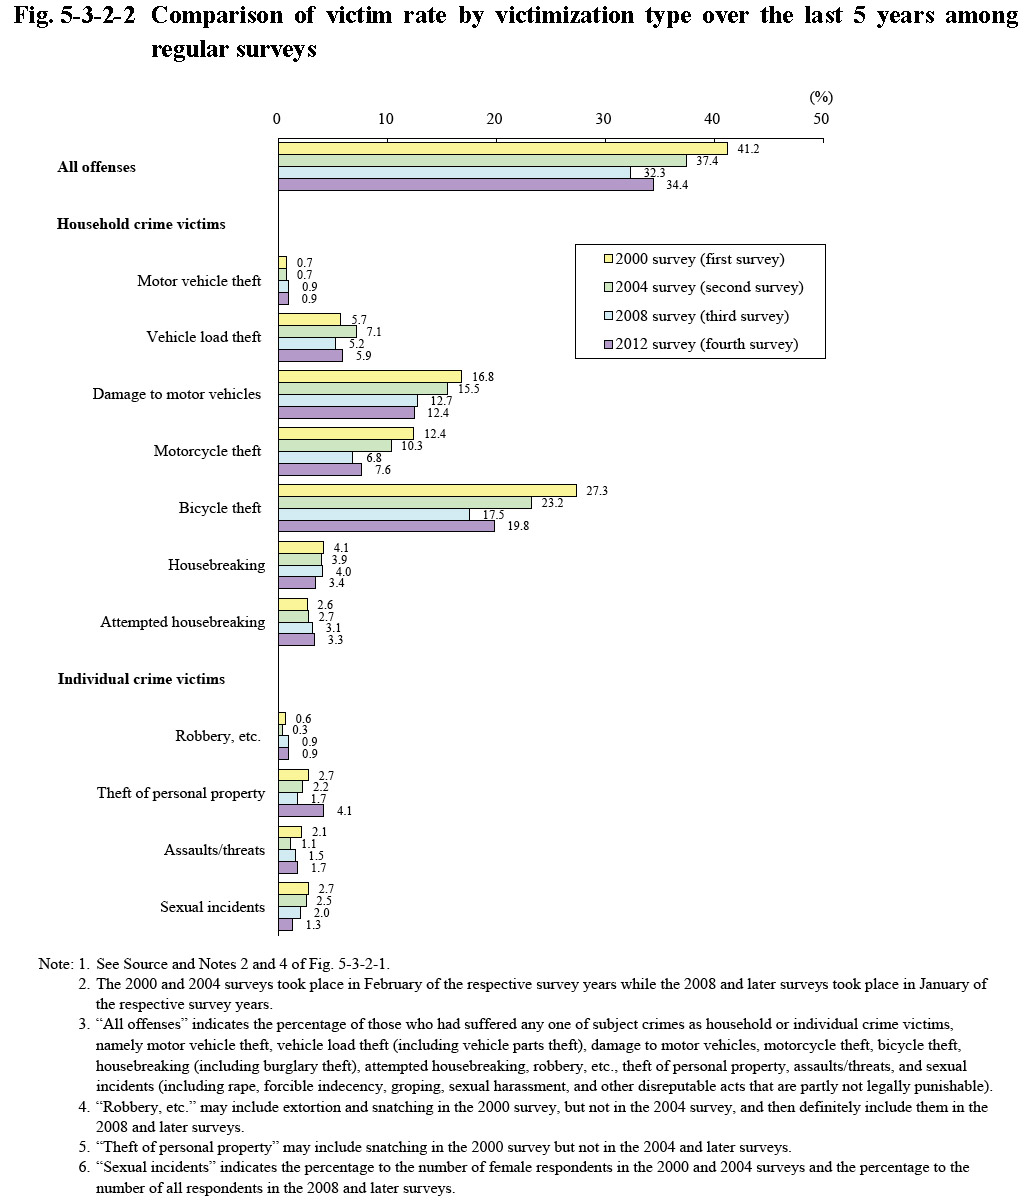
Fig. 5-3-2-2 shows changes in the victim rate of subject crimes for household and individual crime victims by victimization type over the last five years from the 2000 survey through to the 2012 survey. The victim rate of all subject crimes in the 2012 survey revealed no significant changes from the 2008 survey, but which declined from the 2000 survey.
With damage to motor vehicles, motorcycle theft, and bicycle theft, for which the victim rate was relatively high, the victim rate was on a declining trend from the 2000 survey through to the 2008 survey, but with no significant change being observed in the 2012 survey. Sexual incidents were subjects for females only in the 2000 and 2004 surveys but were then subjects for both males and females in the 2008 and later surveys, and thus an overall successive comparison cannot be made. The victim rate of female respondents in the 2012 survey for sexual incidents over the last five years was 2.3%.
Fig. 5-3-2-2 Comparison of victim rate by victimization type over the last 5 years among regular surveys
(2) Victim reporting rate by victimization type
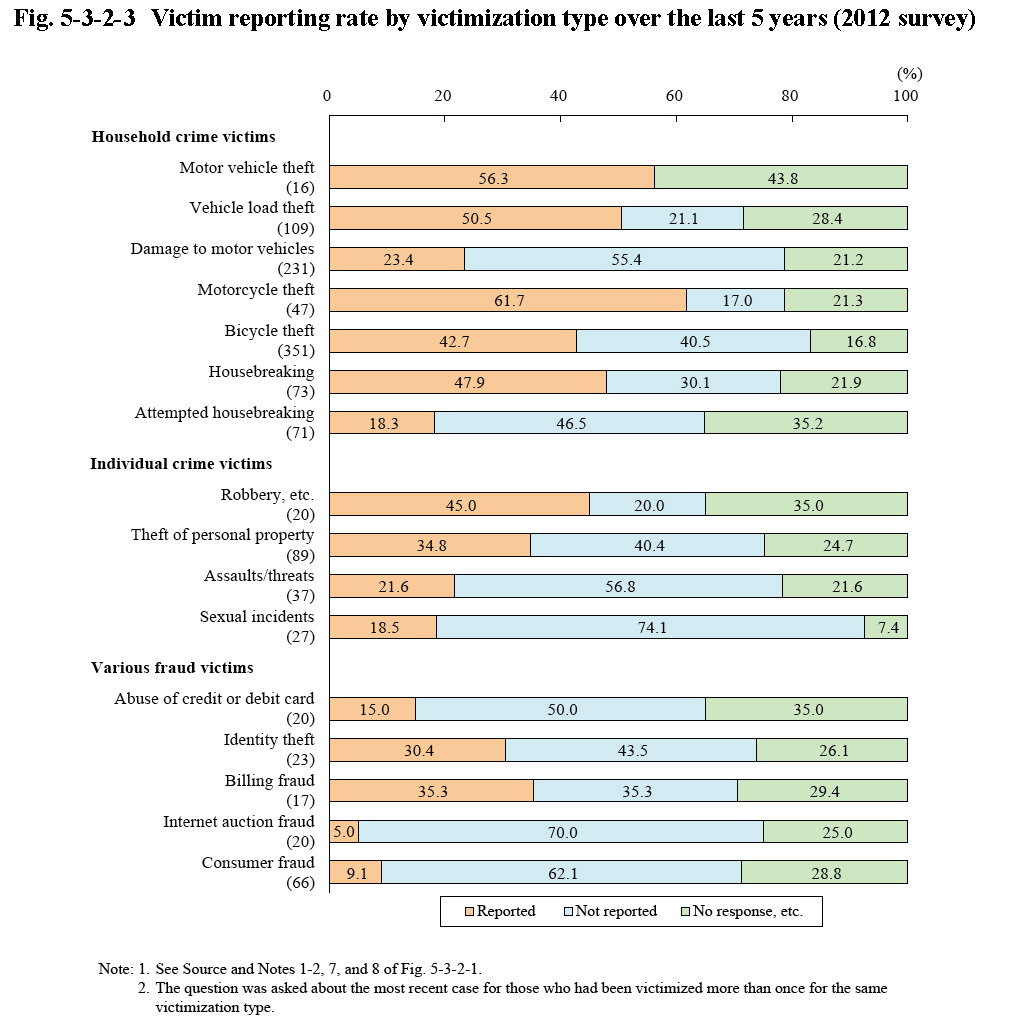
Fig. 5-3-2-3 shows the victim reporting rate (refers to the percentage of victimized households/individuals that reported the fact (the most recent case for those who had been victimized more than once for the same victimization type) to the investigating authorities) of subject crimes by victimization type over the last five years. Most cases not reported to the investigating authorities become dark figures. The answer “did not report” accounted for approximately 20 to 70% across most victimization types. Even after taking into consideration the fact that a certain percentage of no-answer responses existed for each victimization type, the dark figure could be deemed quite large.
In addition, differences in the victim reporting rate were observed between the different victimization types. With household crime victims, the majority reported cases of motorcycle theft, motor vehicle theft, and vehicle load theft, but less than 30% did so for damage to motor vehicles and attempted housebreaking.
Fig. 5-3-2-3 Victim reporting rate by victimization type over the last 5 years (2012 survey)