Section 2 Bodily Damage
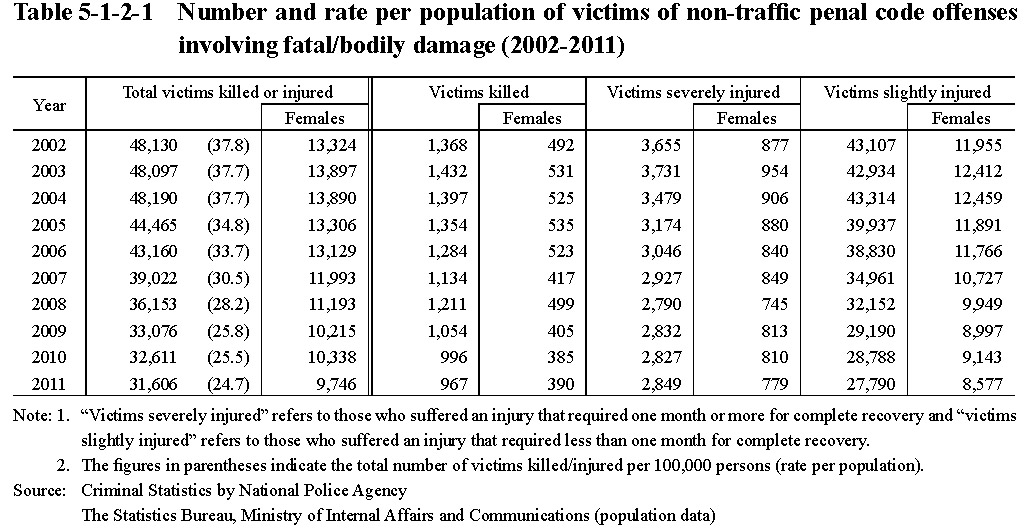
Table 5-1-2-1 shows the number and rate per population of victims of non-traffic penal code offenses involving fatal/bodily damage over the last 10 years. The number of victims killed/injured decreased for seven consecutive years from 2005. The percentage of females of victims killed/injured was around 30%.
Table 5-1-2-1 Number and rate per population of victims of non-traffic penal code offenses involving fatal/bodily damage (2002-2011)