3 Employment status
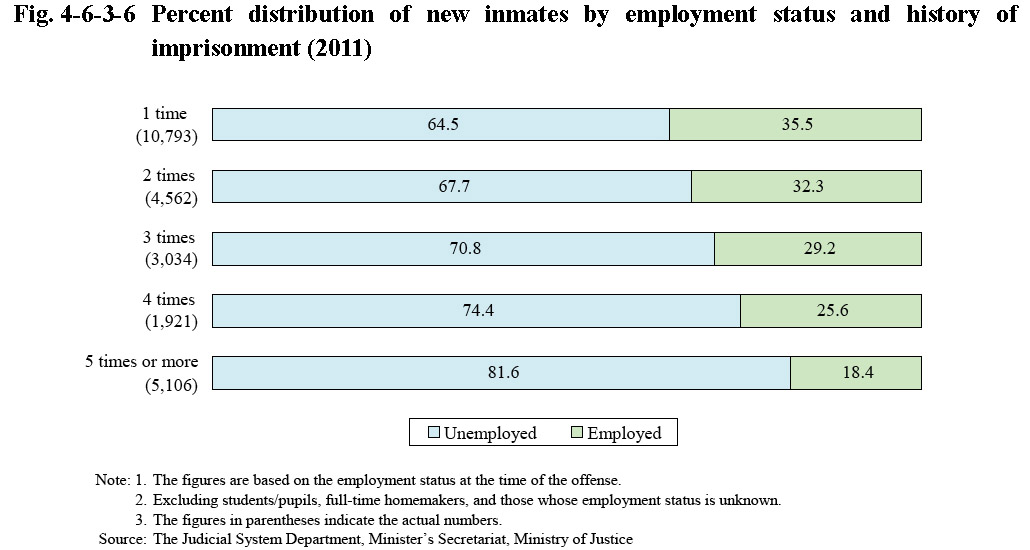
Fig. 4-6-3-6 shows the percent distribution of new inmates in 2011 by employment status and history of imprisonment. The proportion of those unemployed rose as the number of history of imprisonment increased, with that of those imprisoned five times or more being 81.6%.
Fig. 4-6-3-6 Percent distribution of new inmates by employment status and history of imprisonment (2011)