2 Previously convicted adults cleared for non-traffic penal code offenses
Fig. 4-6-1-2 shows the number of previously convicted adults cleared for non-traffic penal code offenses (limited to those with previous convictions for offenses other than Road Traffic Act violations; hereinafter the same in this subsection) and the rate of previously convicted adults (refers to the percentage of previously convicted adults to adults cleared for non-traffic penal code offenses; hereinafter the same in this subsection) over the last 20 years. The number of previously convicted adults cleared for non-traffic penal code offenses continued to increase from 1996, but then decreased slightly over five consecutive years from 2007, and was 64,970 in 2011 (down 2.7% from the previous year). However, the rate of previously convicted adults remained within the range of 22 to 30% from 1992. Examining previously convicted adults cleared for non-traffic penal code offenses in 2011 by number of previous convictions revealed that those with one previous conviction accounted for the highest proportion at 38.7%, but with the proportion of those with five or more previous convictions also being high at 22.3%. In addition, those with previous convictions for the same type of offense (according to a statistical classification made by the National Police Agency) accounted for 52.1% (Source: Criminal Statistics by National Police Agency).
Fig. 4-6-1-2 Number and rate of previously convicted adults cleared for non-traffic penal code offenses (1992-2011)
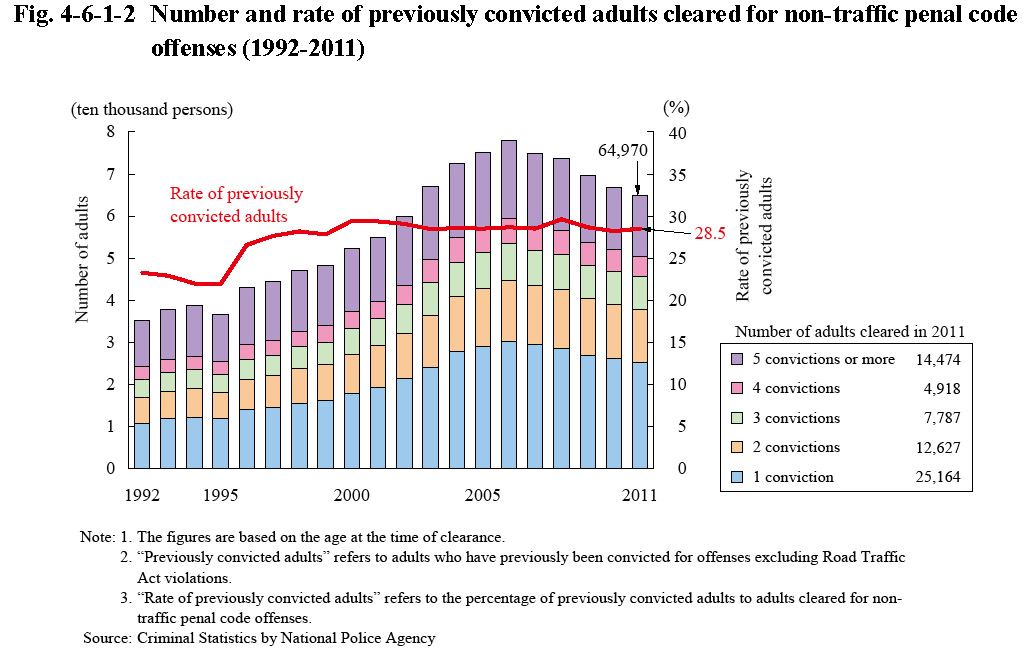
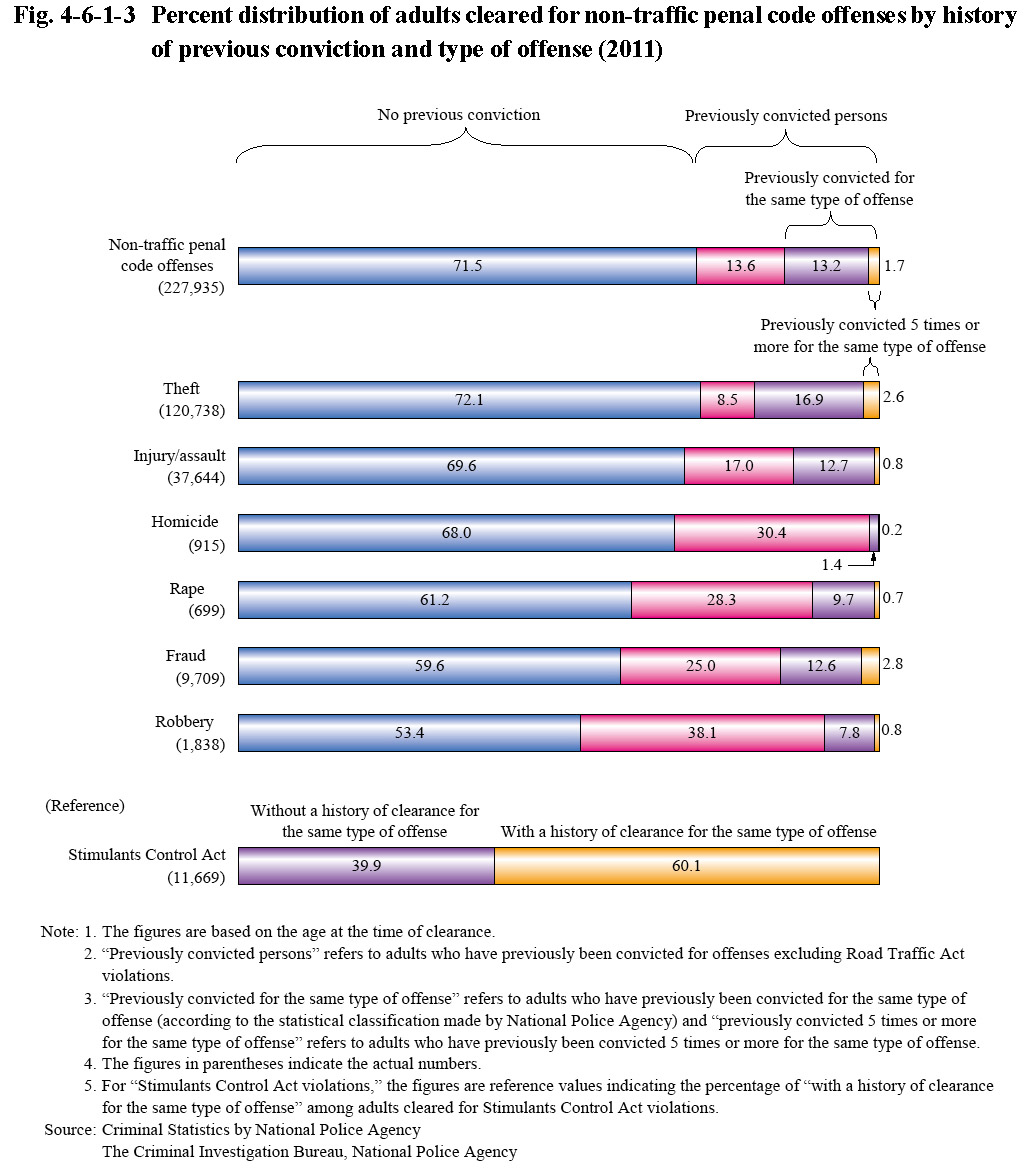
Fig. 4-6-1-3 shows the percent distribution of adults cleared for non-traffic penal code offenses by history of previous conviction and type of offense in 2011.
The rate of previously convicted adults cleared was 28.5% among all the adults cleared for total non-traffic penal code offenses, but was remarkably high for robbery (46.6%) and fraud (40.4%).
The percentage of adults with previous convictions for the same type of offense (according to statistical classifications made by the National Police Agency) was 14.9% for total non-traffic penal code offenses and high for theft at 19.4%. The percentage of persons with five or more previous convictions for the same type of offense was 1.7% for total non-traffic penal code offenses, but high for both theft and fraud at 2.6% and 2.8%, respectively.
The rate of adults who had previously been cleared for Stimulants Control Act violations (including Act on Special Provisions for Narcotics violations concerning stimulants) and were cleared again for violations of the said Act (repeat offenders for the same type of offense) was high at 60.1% in 2011 when compared with the rate of repeat offenders among persons cleared for non-traffic penal code offenses.
Fig. 4-6-1-3 Percent distribution of adults cleared for non-traffic penal code offenses by history of previous conviction and type of offense (2011)