4 Probation/parole supervisionn
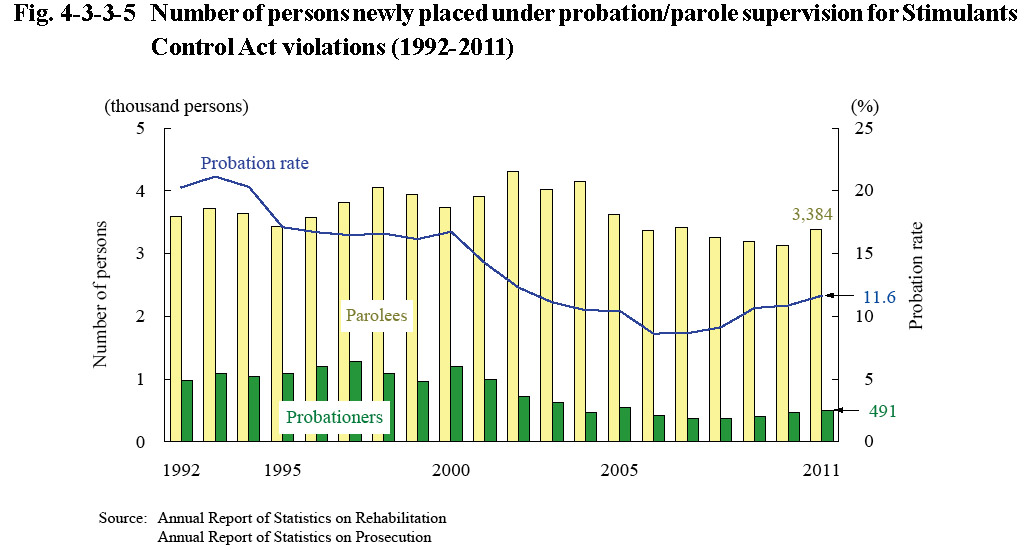
Fig. 4-3-3-5 shows the number of probationers/parolees for Stimulants Control Act violations newly placed under probation/parole supervision over the last 20 years. The number of parolees was on a decreasing trend from 2005 but increased by 8.0% from the previous year in 2011. The number of probationers was on a decreasing trend from 2001 but then started increasing from 2009. The probation rate for Stimulants Control Act violations was 20.3% in 1992, but subsequently was on a declining trend until 2006. It then continued rising every year from 2007 and was 11.6% (up 0.8 points from the previous year) in 2011.
Of probationers/parolees whose probation/parole supervision was terminated in 2011, the percentages of those who had their probation/parole supervision terminated by revocation of suspension of execution of the sentence/parole were 4.0% and 37.1%, respectively (Source: Annual Report of Statistics on Rehabilitation).
Fig. 4-3-3-5 Number of persons newly placed under probation/parole supervision for Stimulants Control Act violations (1992-2011)