2 Correction
(1) Number of new inmates who belonged to organized crime groups
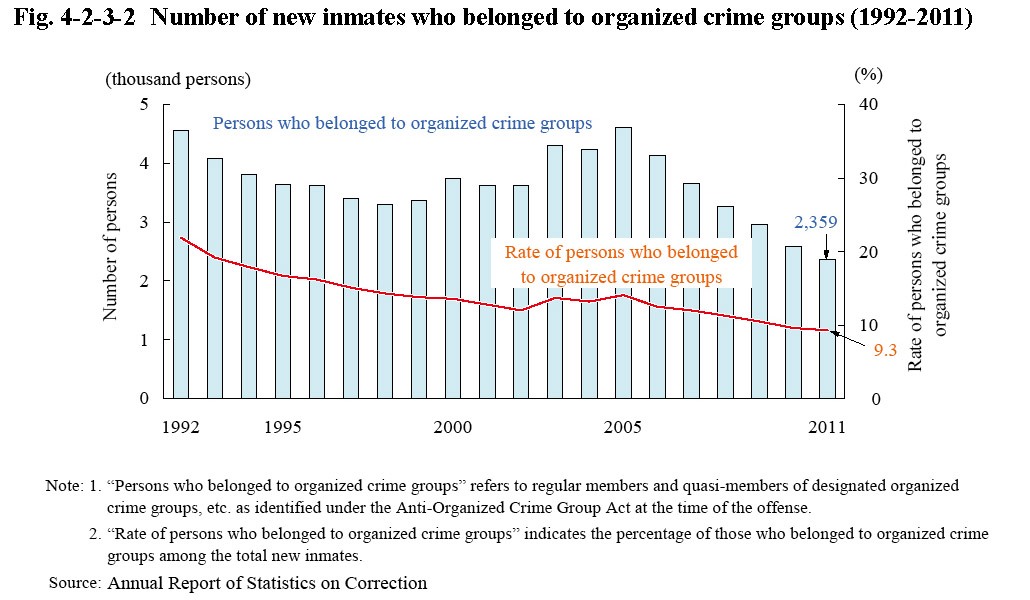
Fig. 4-2-3-2 shows the number of new inmates who belonged to organized crime groups (refers to regular members and quasi-members of designated organized crime groups, etc., as identified under the Anti-Organized Crime Group Act at the time of the offense; hereinafter the same in this subsection), over the last 20 years. The number was 2,359 in 2011, accounting for 9.3% of the total number of new inmates. By their status within the organized crime group, 727 were group leaders, 1,365 regular members, and 267 of unknown status (Source: Annual Report of Statistics on Correction).
Fig. 4-2-3-2 Number of new inmates who belonged to organized crime groups (1992-2011)
(2) Characteristics of inmates who belonged to organized crime groups
a. Age
With respect to the percent distribution of new inmates who belonged to organized crime groups in 2011 by age group, those aged 40-49 were the highest in proportion at 35.1%, followed by 30-39 at 31.5%, 50-59 at 13.7%, 20-29 at 10.8%, and 60 or older at 8.9% (Source: Annual Report of Statistics on Correction).
b. Type of offense
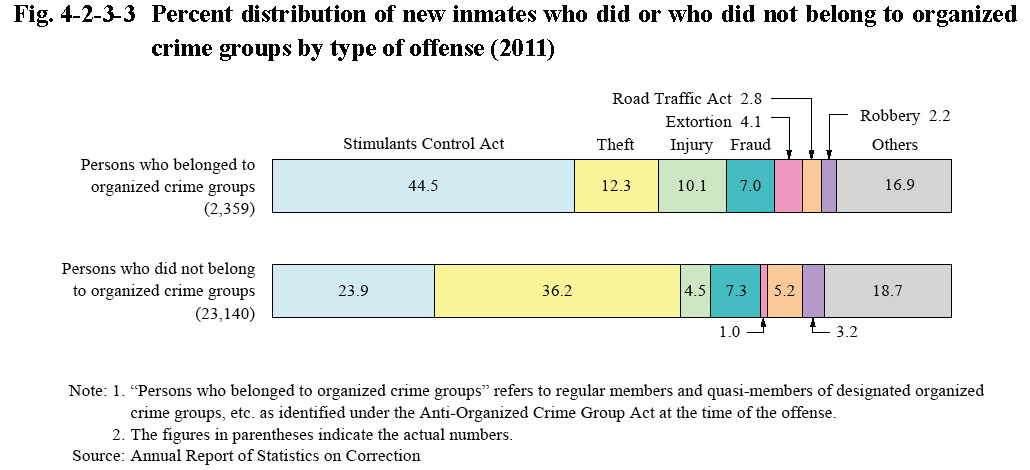
Fig. 4-2-3-3 shows the percent distribution of new inmates who did or did not belong to organized crime groups in 2011 by type of offense. With new inmates who belonged to organized crime groups, the proportions of Stimulants Control Act violations, injury, and extortion were high while that of theft was very low when compared to those who did not belong to them.
Fig. 4-2-3-3 Percent distribution of new inmates who did or who did not belong to organized crime groups by type of offense (2011)
c. Term of imprisonment
Examining the term of imprisonment of new inmates who belonged to organized crime groups in 2011 revealed that those sentenced to imprisonment for “over one year but two years or less” were the highest in proportion at 39.9%, followed by “over two years but three years or less” at 27.1%, “over three years but five years or less” at 12.6%, “over six months but one year or less” at 11.2%, over five years (including life imprisonment) at 7.0%, and six months or less at 2.2%. The proportion of those sentenced to imprisonment for over two years (including life imprisonment) was high at 46.7% when compared to that of total new inmates (40.3%) (Source: Annual Report of Statistics on Correction).
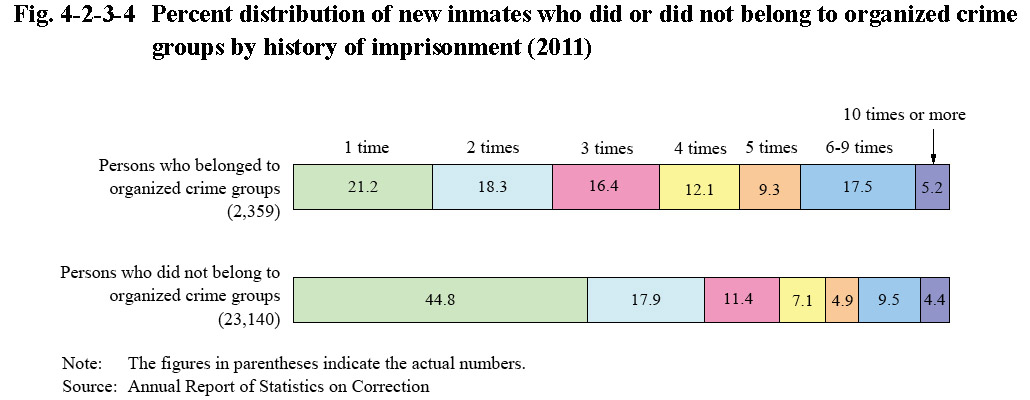
d. History of imprisonment
Fig. 4-2-3-4 shows the percent distribution of new inmates who did or did not belong to organized crime groups in 2011 by their history of imprisonment. Among the new inmates who belonged to organized crime groups, the proportions of those imprisoned two times or more and those imprisoned six times or more were high at 78.8% and 22.7%, respectively, when compared to those who did not belong to them (55.2% and 13.9%, respectively).
Fig. 4-2-3-4 Percent distribution of new inmates who did or did not belong to organized crime groups by history of imprisonment (2011)