Section 2 Trends in Offenses
1 Persons cleared
Fig. 4-2-2-1 shows the number of organized crime group members, etc. cleared (limited to non-traffic penal code offenses and special act offenses excluding violations of traffic related acts (limited to violations of four traffic related acts up to 2003); hereinafter the same in this subsection) over the last 20 years. The number remained within the range of 30-40 thousand until 2003, but then fell to below 30,000 from 2004, and was 26,269 in 2011 (up 2.3% from the previous year).
Fig. 4-2-2-1 Number of organized crime group members, etc. cleared (1992-2011)
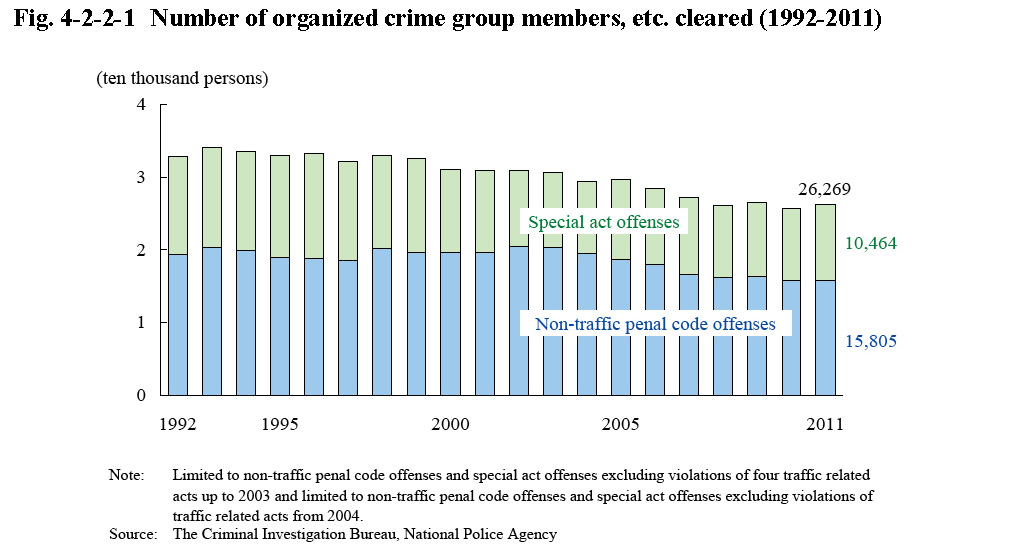
Table 4-2-2-2 shows the number of organized crime group members, etc. cleared and the percentage to total persons cleared in 2011 by type of offense.
Table 4-2-2-2 Number of organized crime group members, etc. cleared by type of offense (2011)
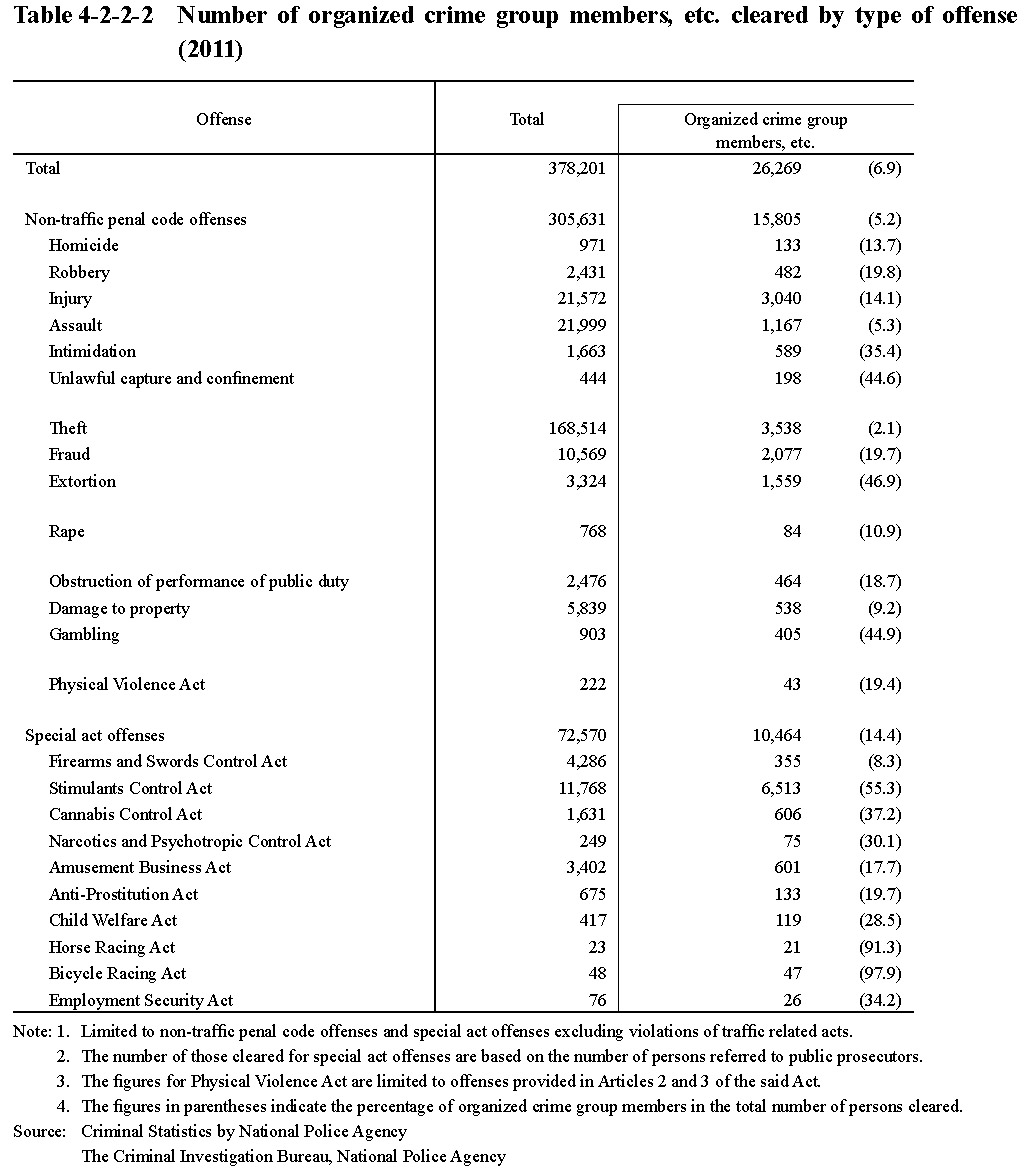
The number of organized crime group members, etc. cleared was the largest for Stimulants Control Act violations, followed by theft, injury, fraud, and extortion, in that order. The percentage of total organized crime group members, etc. to total persons cleared was 6.9%. By type of offense, the percentages were high for extortion (46.9%), gambling (44.9%), and unlawful capture and confinement (44.6%) within non-traffic penal code offenses, and for Bicycle Racing Act violations (97.9%), Horse Racing Act violations (91.3%), and Stimulants Control Act violations (55.3%) within special act offenses.