2 Trends by attributes
(1) Trends by age group
a. Changes in number and rate per population of juveniles cleared by age group
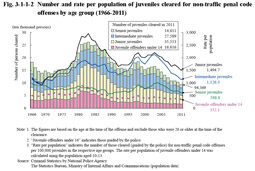
Fig. 3-1-1-2 shows the number and rate per population of juveniles cleared for non-traffic penal code offenses by age group since 1966 (See Appendix 3-2). The number and rate per population were both generally on a decreasing/declining trend across all age groups from 2004. The rate per population has been the highest with junior juveniles, followed by intermediate juveniles, and senior juveniles, and then juvenile offenders under 14 since 1984.
Fig. 3-1-1-2 Number and rate per population of juveniles cleared for non-traffic penal code offenses by age group (1966-2011)
b. Delinquency rate of juveniles
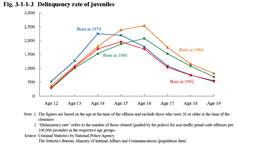
Fig.3-1-1-3 shows the delinquency rate (number of juveniles born in 1974, 1980, 1986, 1992 (estimate) and cleared (guided by the police) for non-traffic penal code offenses per 100,000 persons in the respective age groups) which reveals how it changes as the juveniles mature. With those born in 1974, the delinquency rate at a younger age was higher than with the others and the peak age was lower at 14 when compared to the others at 15-16. In contrast, the delinquency rate at age 15 or older was consistently higher with those born in 1986 than the others.
Fig. 3-1-1-3 Delinquency rate of juveniles
(2) Trends by gender
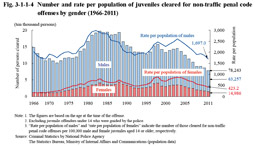
Fig. 3-1-1-4 shows the number and rate per population of juvenile offenders cleared (for non-traffic penal code offenses) by gender since 1966. The female rate generally remained within the range of 18 to 25% from 1976, and was 19.2% in 2011 (down 0.8 points from the previous year).
Fig. 3-1-1-4 Number and rate per population of juveniles cleared for non-traffic penal code offenses by gender (1966-2011)
(3) Educational/employment status and delinquencies
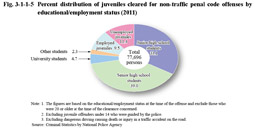
Fig. 3-1-1-5 shows the percent distribution of juvenile offenders cleared (for non-traffic penal code offenses excluding dangerous driving causing death or injury in a traffic accident on the road) by educational/employment status in 2011. Senior high school students accounted for the highest proportion, followed by junior high school students, and then unemployed juveniles, in that order.
Fig. 3-1-1-5 Percent distribution of juveniles cleared for non-traffic penal code offenses by educational/employment status (2011)


