1 Number of probationers/parolees
(1) Number of persons newly placed under probation/parole supervision
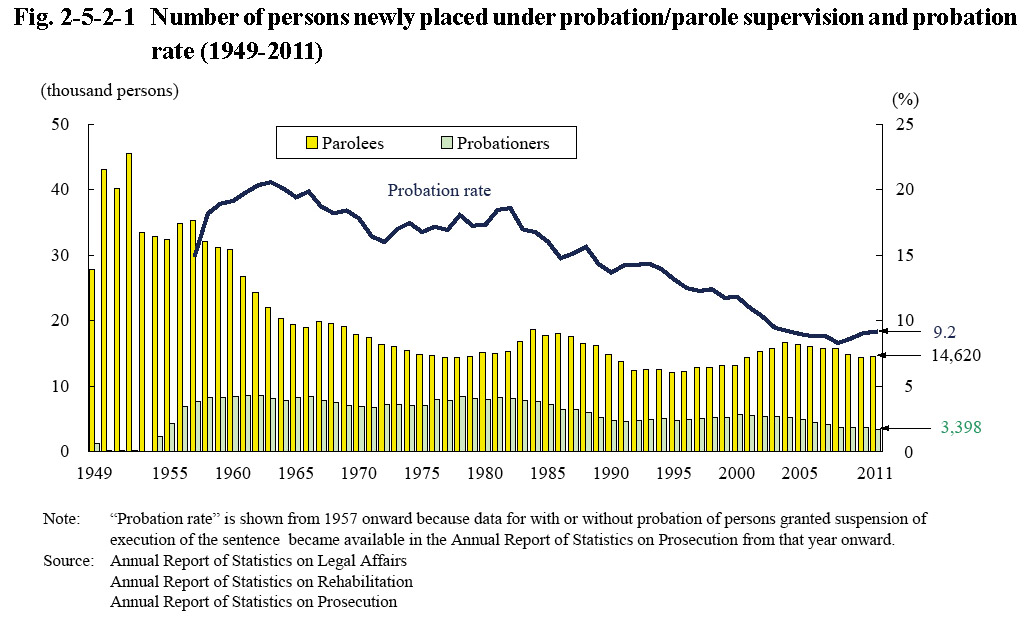
Fig. 2-5-2-1 shows the number of persons newly placed under probation/parole supervision since 1949 and the probation rate since 1957. The number of persons newly placed under parole supervision was on a slightly decreasing trend from 2005, but then slightly increased in 2011. The number was on a decreasing trend from 2001 with probationers. The probation rate peaked at 20.6% in 1963, then remained basically at the same level, although with some ups and downs, but then turned to follow a declining trend around 1980, and declined to 8.3% in 2008. However, it then turned to rise in 2009, and was 9.2% in 2011 (up 0.1 points from the previous year). As of the end of 2011 the number of parolees was 5,988 (up 0.4% from the end of the previous year) and the number of probationers 11,318 (down 3.8% (id.)) (Source: Annual Report of Statistics on Rehabilitation).
Fig. 2-5-2-1 Number of persons newly placed under probation/parole supervision and probation rate (1949-2011)
(2) Characteristics of probationers/parolees
a. Age
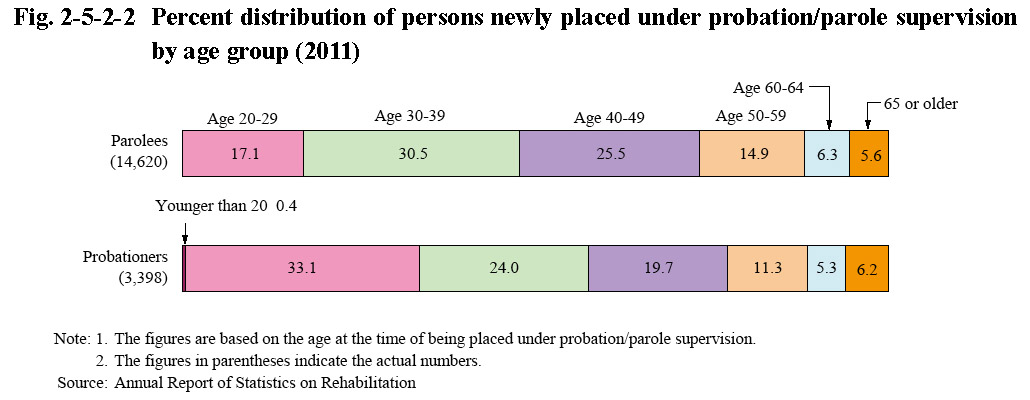
Fig. 2-5-2-2 shows the percent distribution of persons newly placed under probation/parole supervision by age group in 2011.
Fig. 2-5-2-2 Percent distribution of persons newly placed under probation/parole supervision by age group (2011)
b. Type of offense
Examining the percent distribution of persons newly placed under probation/parole supervision in 2011 by type of offense revealed that with male parolees theft accounted for the highest proportion, followed by Stimulants Control Act violations and then fraud, and with female parolees Stimulants Control Act violations accounted for the highest proportion, followed by theft and then fraud. With both male and female probationers, theft accounted for the highest proportion, followed by Stimulants Control Act violations and then injury (See Appendix 2-13).
c. Probation/parole supervision period
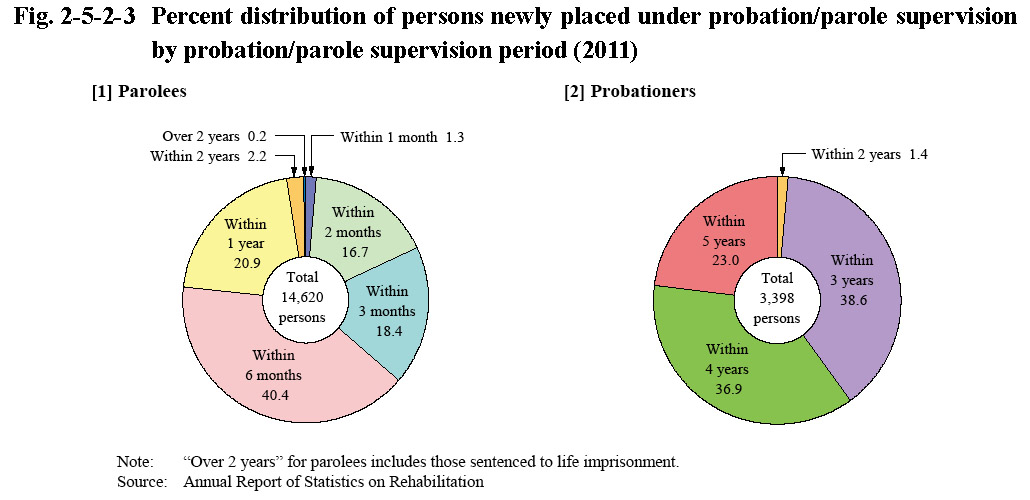
Fig. 2-5-2-3 shows the percent distribution of persons newly placed under probation/parole supervision in 2011 by probation/parole supervision period. The parole supervision period of parolees was mostly one year or less, with 3/4 or more of parolees having a parole supervision period of six months or less. The probation period (period of suspension of execution of the sentence) is usually specified in units of a year, and hence for most of them is three years or more (three, four, or five years).
Fig. 2-5-2-3 Percent distribution of persons newly placed under probation/parole supervision by probation/parole supervision period (2011)
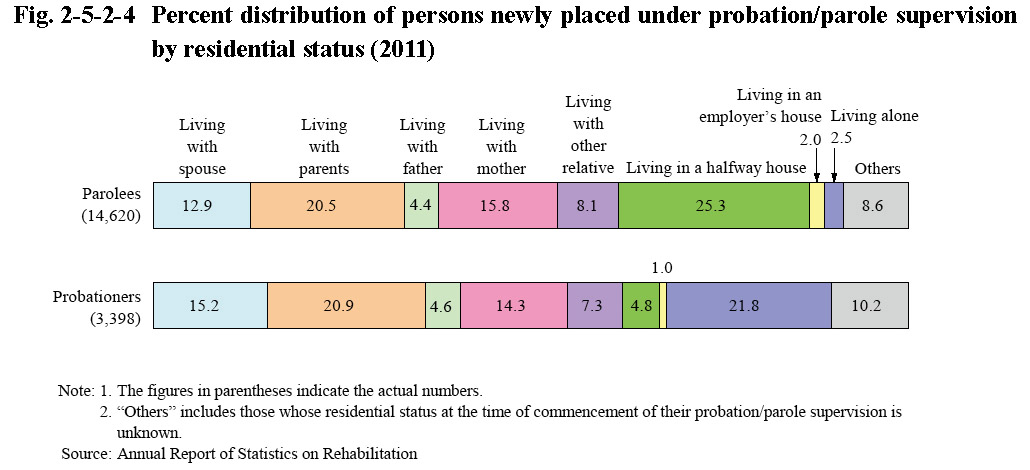
d. Residential status
Fig. 2-5-2-4 shows the percent distribution of persons newly placed under probation/parole supervision in 2011 by their residential status. The proportion of those living in halfway houses was the highest with parolees while the proportion of those living alone was the highest with probationers.
Fig. 2-5-2-4 Percent distribution of persons newly placed under probation/parole supervision by residential status (2011)