Chapter 2 Special Act Offenses
Section 1 Principal Data
The principal data on special act offenses in 2011 is as follows.
| Principal 2011 special act offense data | |||
|---|---|---|---|
| Number of persons newly received by public prosecutors | (Proportion) | (Changes from the previous year) | |
| Source: Annual Report of Statistics on Prosecution | |||
| [1] Road Traffic Act violations | 416,553 | (80.5%) | (-32,370, -7.2%) |
| [2] Stimulants Control Act violations | 19,700 | (3.8%) | (+37, +0.2%) |
| [3] Minor Offenses Act violations | 10,968 | (2.1%) | (-2,831, -20.5%) |
| [4] Waste Management Act violations | 7,764 | (1.5%) | (-798, -9.3%) |
| [5] Firearms and Swords Control Act violations | 5,502 | (1.1%) | (-778, -12.4%) |
| [6] Automobile Liability Security Act violations | 4,497 | (0.9%) | (-638, -12.4%) |
| [7] Amusement Business Act violations | 3,922 | (0.8%) | (+9, +0.2%) |
| [8] Car Parking Spaces Act violations | 3,806 | (0.7%) | (-620, -14.0%) |
| [9] Immigration Control Act violations | 3,534 | (0.7%) | (-961, -21.4%) |
| [10] Cannabis Control Act violations | 2,578 | (0.5%) | (-890, -25.7%) |
| Others | 38,314 | (7.4%) | |
| Total | 517,138 | (100.0%) | (-41,041, -7.4%) |
| [Total in 1992] | [Change from 1992] | ||
| 1,302,438 | [-785,300, -60.3%] | ||
Fig. 1-2-1-1 shows the number of persons newly received by public prosecutors for special act offenses since 1949. The number of persons received for all special act offenses sharply decreased when the traffic infraction notification system came into force in 1968, and then remained within the range of two to three million from 1975 through to 1984. It then sharply decreased again due to expansion of the scope of the system in 1987, but subsequently showed an overall decreasing trend. However, the number of persons received for special act offenses excluding violations of road traffic related acts started to increase from 2001, but then turned to follow a generally decreasing trend from 2008. It decreased by 7.7% from the previous year in 2011.
Fig. 1-2-1-1 Number of persons newly received by public prosecutors for special act offenses (1949-2011)
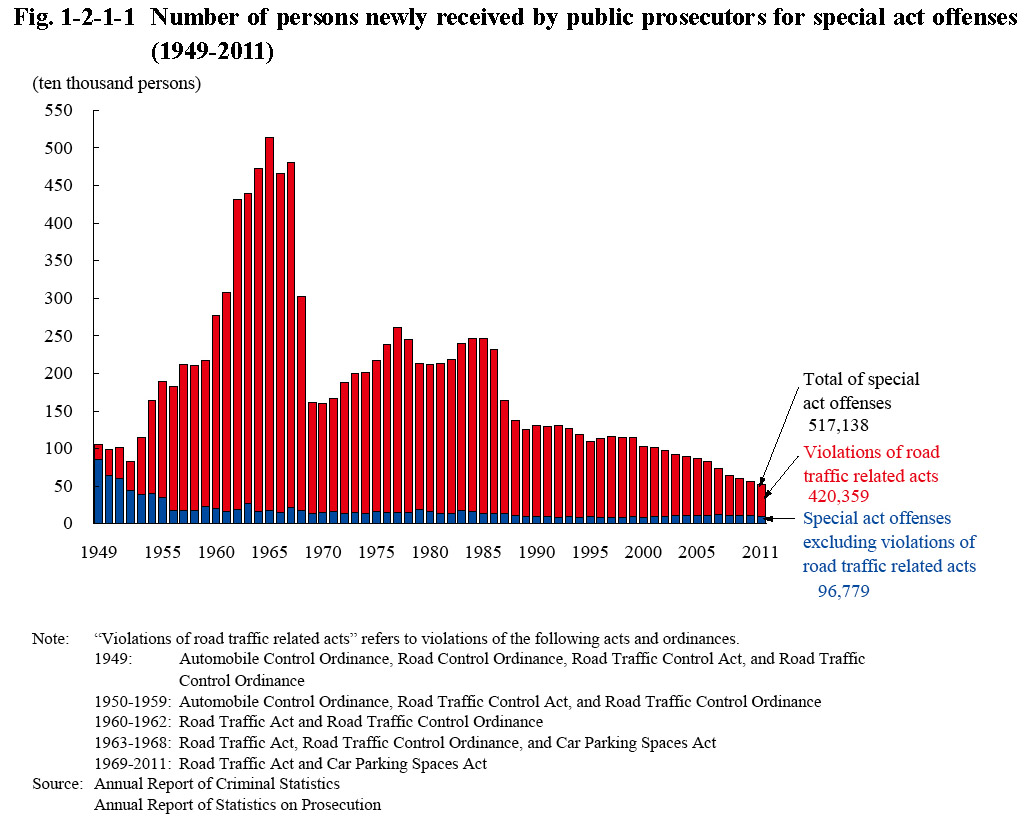
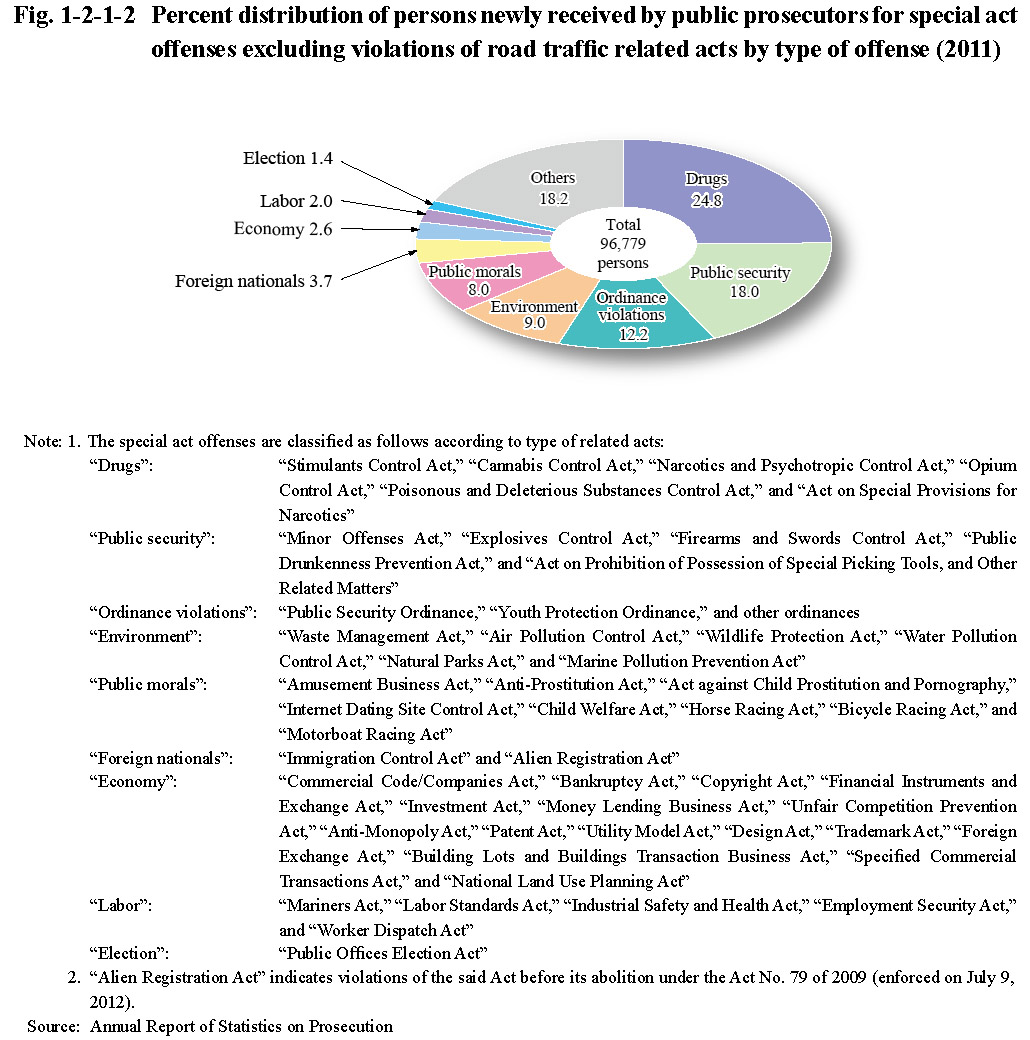
Fig. 1-2-1-2 shows the percent distribution of persons newly received by public prosecutors for special act offenses excluding violations of road traffic related acts by type of offense in 2011 (See Appendix 1-4 for the number of persons received for the respective offenses).
Fig. 1-2-1-2 Percent distribution of persons newly received by public prosecutors for special act offenses excluding violations of road traffic related acts by type of offense (2011)