2 History of protective measures with juveniles/young people placed under protective measures
(1) Percent distribution by history of protective measures
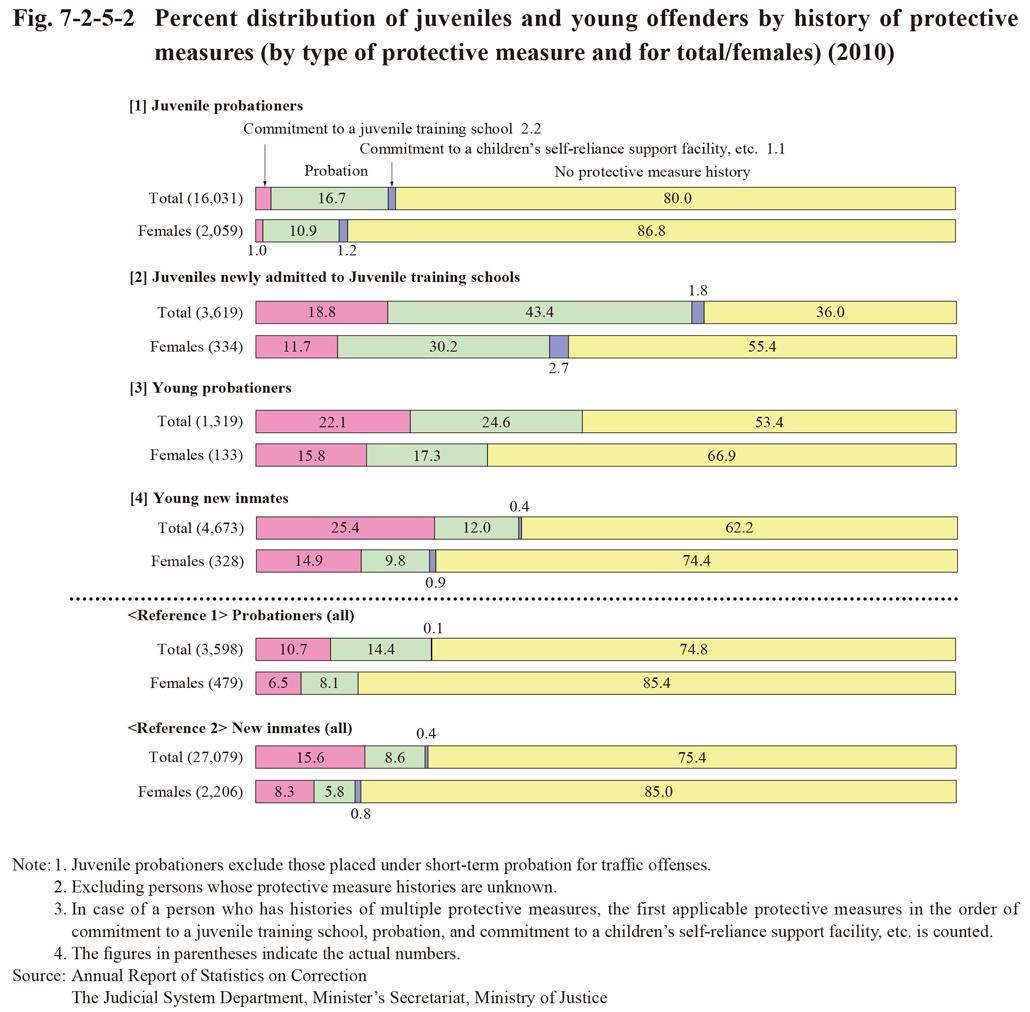
Fig. 7-2-5-2 shows the percent distribution of juvenile probationers, juveniles newly admitted to juvenile training schools, young probationers, and young new inmates in 2010 by history of protective measures. The percentage of persons with a history of protective measures (those who had previously been placed under protective measures) was the highest with juveniles newly admitted to juvenile training schools, followed by young probationers, and then young new inmates. In addition, 46.6% of young probationers and 37.8% of young new inmates had a history of protective measures and the percentage of persons with a history of protective measures of them was high when compared to total probationers and total new inmates. Quite a few of those placed under those measures were considered not to have had their juvenile delinquent tendencies successfully corrected and thus received criminal punishment. With every measure the percentage of persons with a history of protective measures was higher with males than with females, with the difference being particularly large at 21.4 points with juveniles newly admitted to juvenile training schools.
Fig. 7-2-5-2 Percent distribution of juveniles and young offenders by history of protective measures (by type of protective measure and for total/females) (2010)
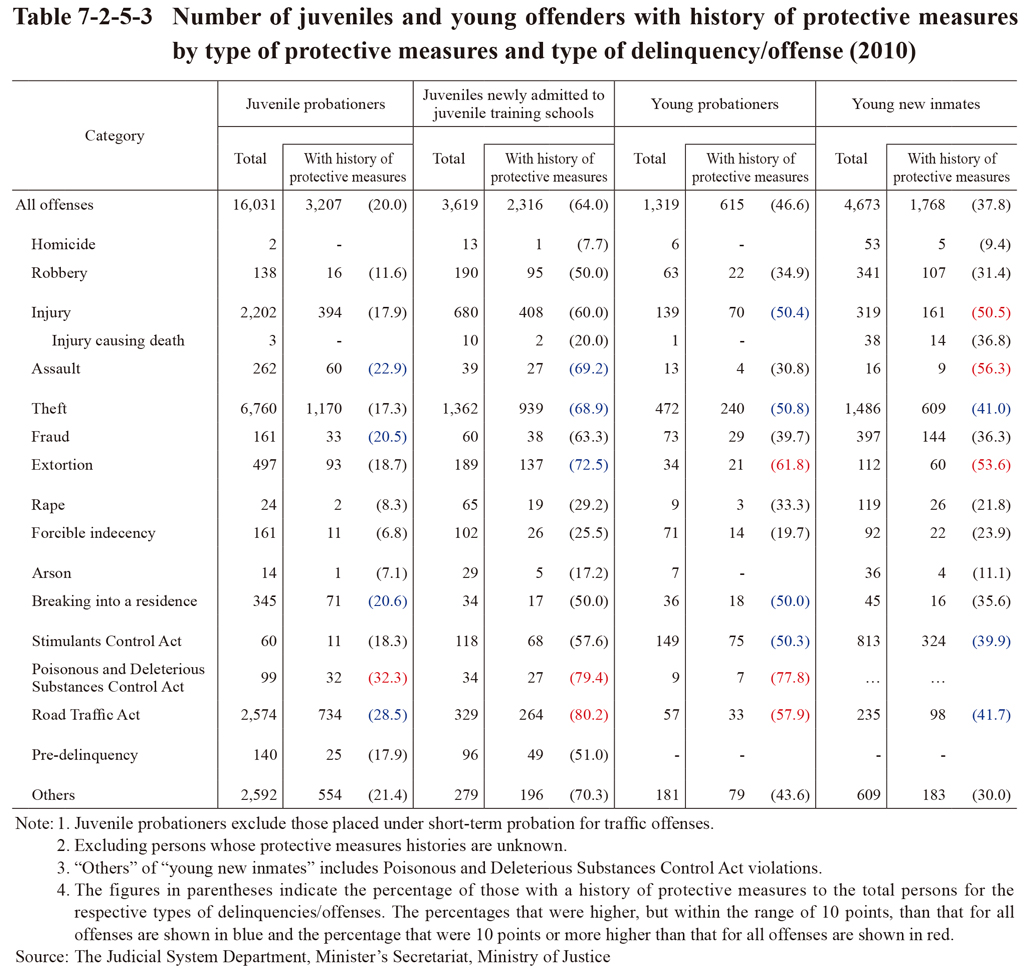
(2) History of protective measures by type of delinquency/offense
Table 7-2-5-3 shows the number of juvenile probationers, juveniles newly admitted to juvenile training schools, young probationers, and young new inmates with a history of protective measures in 2010 by type of delinquency/offense. The percentage of persons with a history of protective measures was high (in the order from the highest to less) for Poisonous and Deleterious Substances Control Act violations (32.3%) and Road Traffic Act violations (28.5%) with juvenile probationers, Road Traffic Act violations (80.2%), Poisonous and Deleterious Substances Control Act violations (79.4%), extortion (72.5%), assault (69.2%), and theft (68.9%) with juveniles newly admitted to juvenile training schools, Poisonous and Deleterious Substances Control Act violations (77.8%), extortion (61.8%), Road Traffic Act violations (57.9%), theft (50.8%), injury (50.4%), and Stimulants Control Act violations (50.3%) with young probationers, and assault (56.3%), extortion (53.6%), and injury (50.5%) with young new inmates.
Table 7-2-5-3 Number of juveniles and young offenders with history of protective measures by type of protective measures and type of delinquency/offense (2010)