2 Implementation status of lay judge system
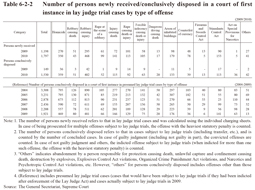
Table 6-2-2 shows the number of persons newly received and conclusively disposed (including transfer, etc.; hereinafter the same in this subsection) in a court of first instance in lay judge trial cases (refers to cases that were subjected to lay judge trials and those consolidated with any such cases) by type of offense in 2009 and 2010. In 2010 the number of persons newly received was the largest for robbery causing injury (total of 468), followed by homicide (total of 350), arson of inhabited buildings (total of 179), and Stimulants Control Act violations (total of 153) while the number of persons conclusively disposed was the largest for robbery causing injury (402), followed by homicide (359), arson of inhabited buildings (133), and injury causing death (115).
The number of persons conclusively disposed given in the table between 2004 and 2008 as a reference refers to that of those in cases that would have been subject to lay judge trials if they had been indicted after enforcement of the Lay Judge Act (hereinafter referred to as “presumed lay judge trial cases” in this subsection) whereas that in 2009 refers to that in cases subject to lay judge trials and in presumed lay judge trial cases.
Table 6-2-2 Number of persons newly received/conclusively disposed in a court of first instance in lay judge trial cases by type of offense
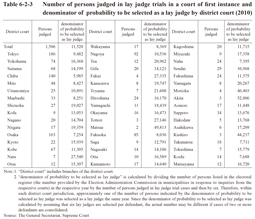
Table 6-2-3 shows the number of persons conclusively judged in lay judge trials in a court of first instance in 2010 at each district court (including branches; hereinafter the same in this subsection) and the denominator of probability to be selected as a lay judge (refers to the number such that one of this number was selected as a lay judge). Within each district court jurisdiction approximately one of the number of persons indicated by the denominator of probability to be selected as a lay judge was selected as a lay judge the same year.
Table 6-2-3 Number of persons judged in lay judge trials in a court of first instance and denominator of probability to be selected as a lay judge by district court (2010)
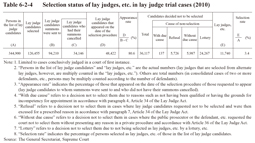
Table 6-2-4 shows the status of the selection of lay judges, etc. in lay judge trial cases conclusively judged in a court of first instance in 2010. The number of persons selected from the list of lay judge candidates and summoned on the date of the selection procedure (excluding those whose summons cancelled) totaled 60,064, of which 48,422 actually appeared, thus at a percentage (appearance rate) of 80.6%. The number of persons selected as lay judges, etc. was 11,740 and the percentage of persons in the list of lay judge candidates (selection rate) was 3.4%.
Table 6-2-4 Selection status of lay judges, etc. in lay judge trial cases (2010)
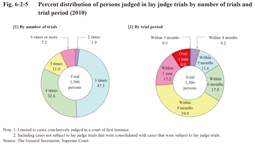
Fig. 6-2-5 shows the percent distribution of persons judged in lay judge trials in a court of first instance in 2010 by number of trials and trial period (period between new receipt and conclusive judgment). A total of five or less trials took place in the majority of cases, with cases in which trials were held three times or less accounting for 49.2%. The average number of trials was 3.8. In addition, a trial that took no more than six months accounted for 34.0% of the cases and 8.3 months on average (Source: The General Secretariat, Supreme Court).
Fig. 6-2-5 Percent distribution of persons judged in lay judge trials by number of trials and trial period (2010)
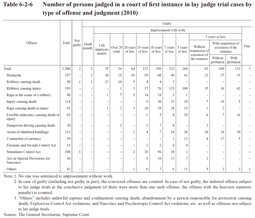
Table 6-2-6 shows judgments of guilty or not guilty and the sentencing of convicted persons in a court of first instance for cases subject to lay judge trials conclusively judged in 2010 by type of offense.
Table 6-2-6 Number of persons judged in a court of first instance in lay judge trial cases by type of offense and judgment (2010)
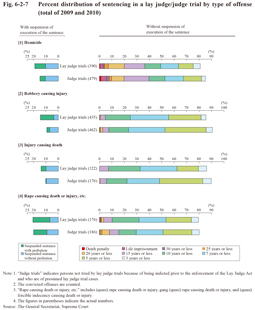
Fig. 6-2-7 shows the sentencing of persons convicted in a court of first instance for offenses subject to lay judge trial (total of 2009 and 2010) by type of offense and type of trial (lay judge trials or judge trials).
Fig. 6-2-7 Percent distribution of sentencing in a lay judge/judge trial by type of offense (total of 2009 and 2010)
