2 Firearm offenses
(1) Violent conflict incidents
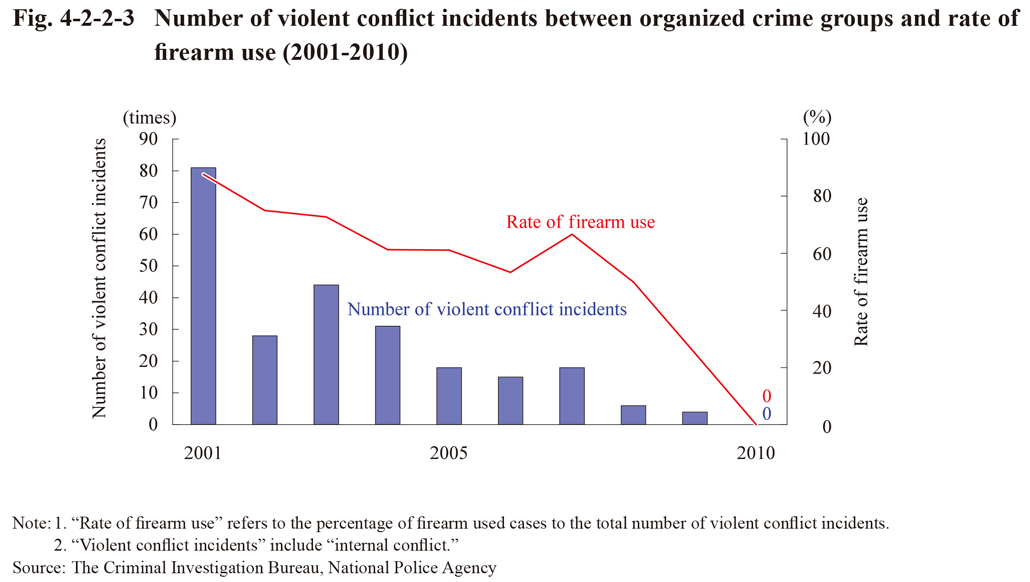
Fig. 4-2-2-3 shows the number of violent conflict incidents between organized crime groups and the rate of firearm (refers to handguns, rifles, machine guns, artillery, hunting guns, and other guns that have the function of firing metal bullets, and also air guns) use (the percentage of firearm used cases to the total number of violent conflict incidents) over the last 10 years. No violent conflict incidents between organized crime groups took place in 2010.
Fig. 4-2-2-3 Number of violent conflict incidents between organized crime groups and rate of firearm use (2001-2010)
(2) Firing incidents
Fig. 4-2-2-4 shows the number of firing incidents and persons killed in those incidents over the last 10 years.
Fig. 4-2-2-4 Number of firing incidents and persons killed (2001-2010)
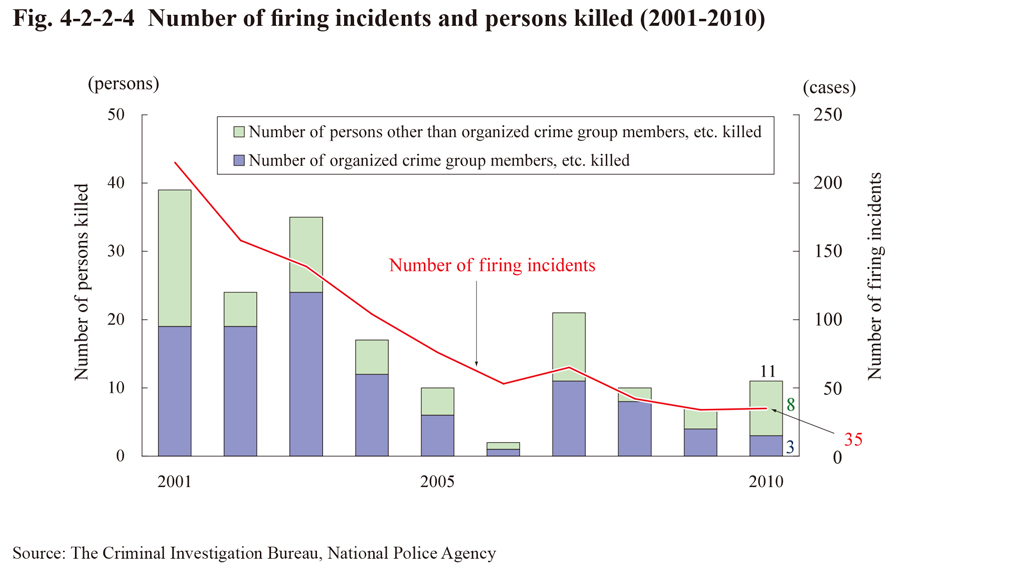
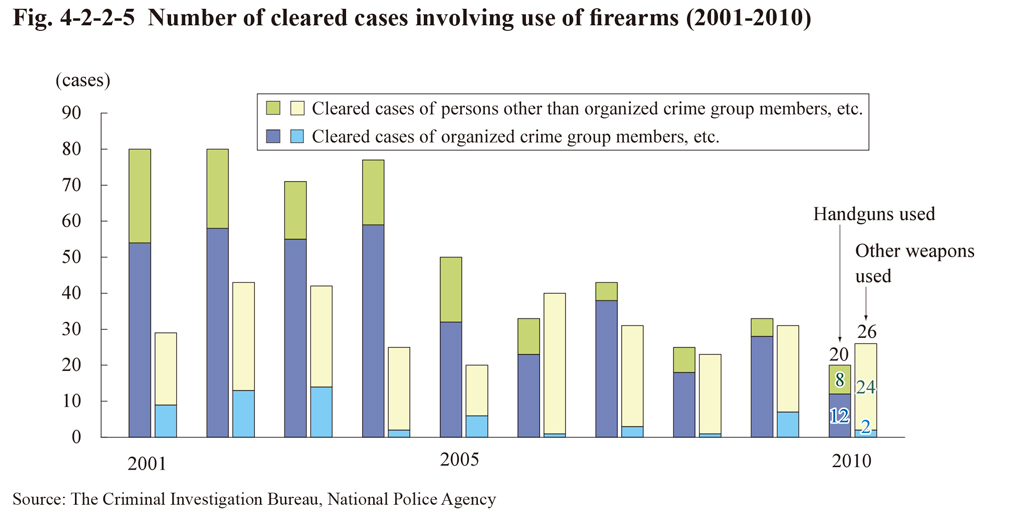
Fig. 4-2-2-5 shows the number of cleared cases involving use of firearms by whether the firearms were handguns or other types of weapons, over the last 10 years.
Fig. 4-2-2-5 Number of cleared cases involving use of firearms (2001-2010)
(3) Trends in handguns being seized
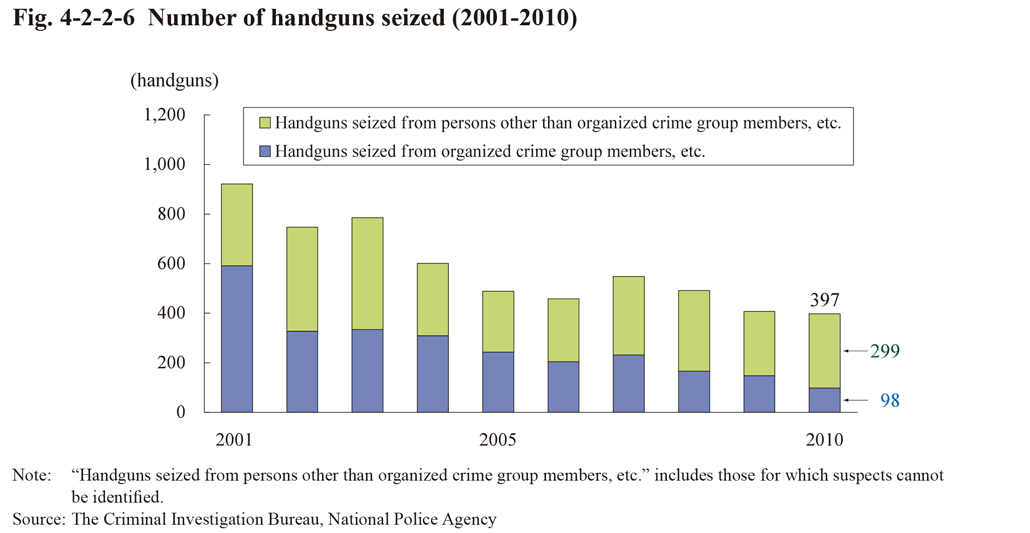
Fig. 4-2-2-6 shows the number of handguns seized over the last 10 years. The number of handguns seized in 2010 was 397 (down 10 (2.5%) from the previous year), of which 356 (89.7%) were genuine handguns. With respect to the country in which the seized genuine handguns had been manufactured the U.S.A. was the largest in number (90), followed by Japan (77), Belgium (34), Russia (including the former Soviet Union) (20), China (19), Spain (16), Germany (15), Brazil (13), and the Philippines (12) (Source: The Criminal Investigation Bureau, National Police Agency).
Fig. 4-2-2-6 Number of handguns seized (2001-2010)