Section 3 Classification in Juvenile Classification Homes
1 Admission and discharge
(1) Number of juveniles newly admitted to juvenile classification homes
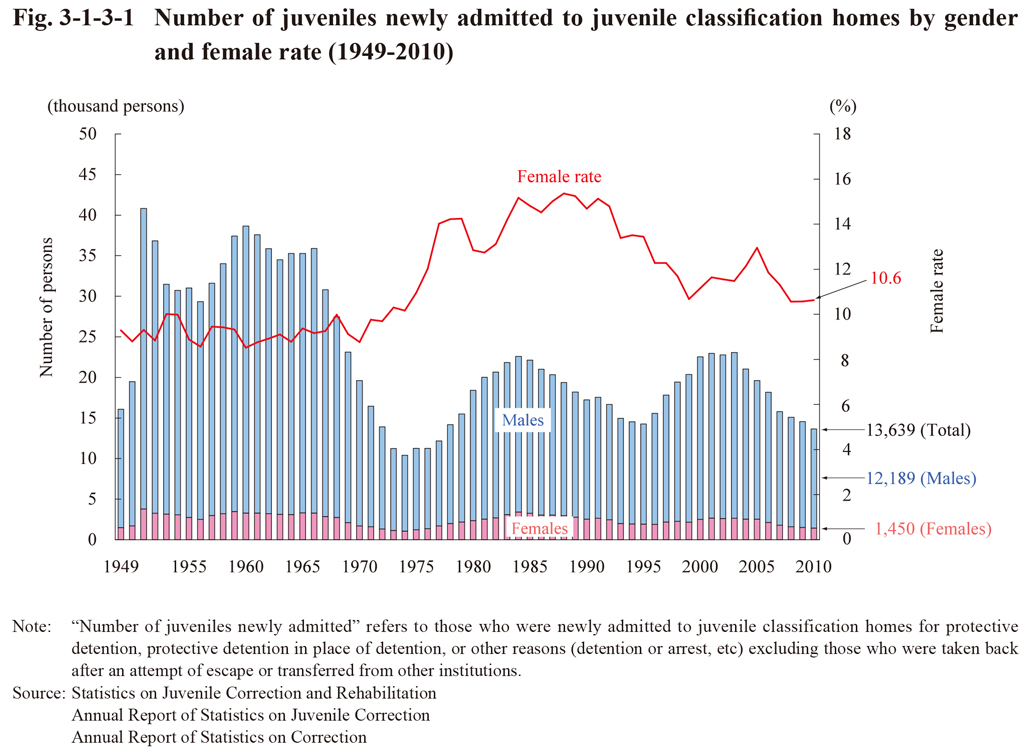
Fig. 3-1-3-1 shows the number of juveniles newly admitted to juvenile classification homes from 1949 (those newly admitted for protective detention, protective detention in place of detention, or other reason (detention, arrest, etc.), being equivalent to the “number of juveniles newly admitted to juvenile classification homes” in the Annual Report of Statistics on Correction). The number increased from 1996, eventually reaching the largest since 1970 in 2003, but then continued to decrease over the next seven consecutive years (See Appendix 3-4). In 2010, 85.5% were admitted for protective detention and 10.4% for protective detention in place of detention (Source: Annual Report of Statistics on Correction).
Fig. 3-1-3-1 Number of juveniles newly admitted to juvenile classification homes by gender and female rate (1949-2010)
(2) Characteristics of juveniles detained in juvenile classification homes
Fig. 3-1-3-2 shows the percent distribution of juveniles detained in juvenile classification homes by age group and gender over the last 20 years. With males the proportion of junior juveniles was generally on a rising trend and the proportion of senior juveniles on a declining trend. The proportion of those detained at a young age was higher with females than males.
Fig. 3-1-3-2 Percent distribution of juveniles detained in juvenile classification homes by age group and gender (1991-2010)
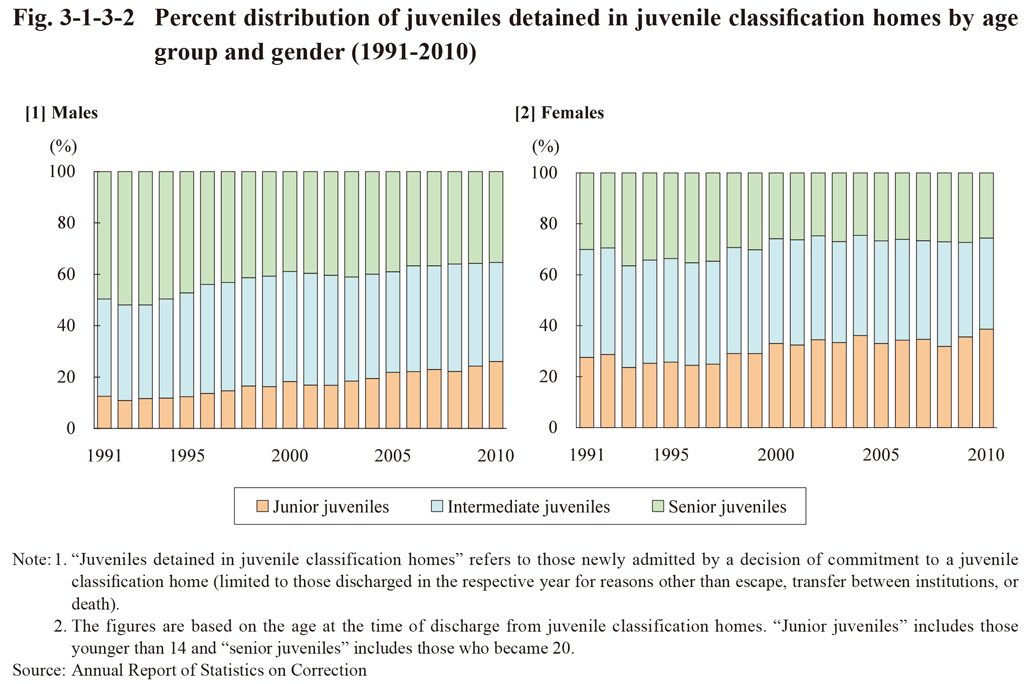
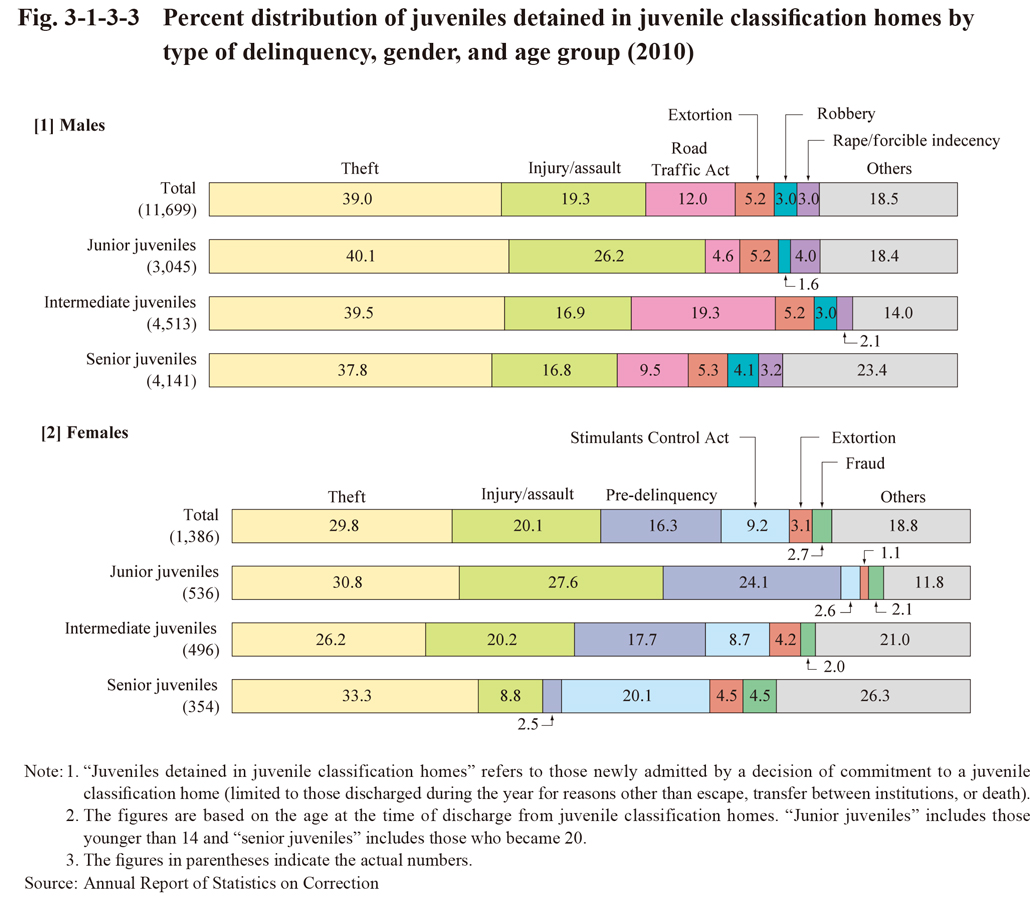
Fig. 3-1-3-3 shows the percent distribution of juveniles detained in juvenile classification homes by type of delinquency, gender, and age group in 2010. With males the proportion for theft was the highest across all age groups, followed by injury/assault, Road Traffic Act violations, and extortion, etc., and with the proportion for Stimulants Control Act violations being remarkably low (the highest proportion was 1.7% with senior juveniles). With females the proportion for pre-delinquency and injury/assault declined as the age of the group rose whereas that of Stimulants Control Act violations rose.
Fig. 3-1-3-3 Percent distribution of juveniles detained in juvenile classification homes by type of delinquency, gender, and age group (2010)
(3) Reason for discharge
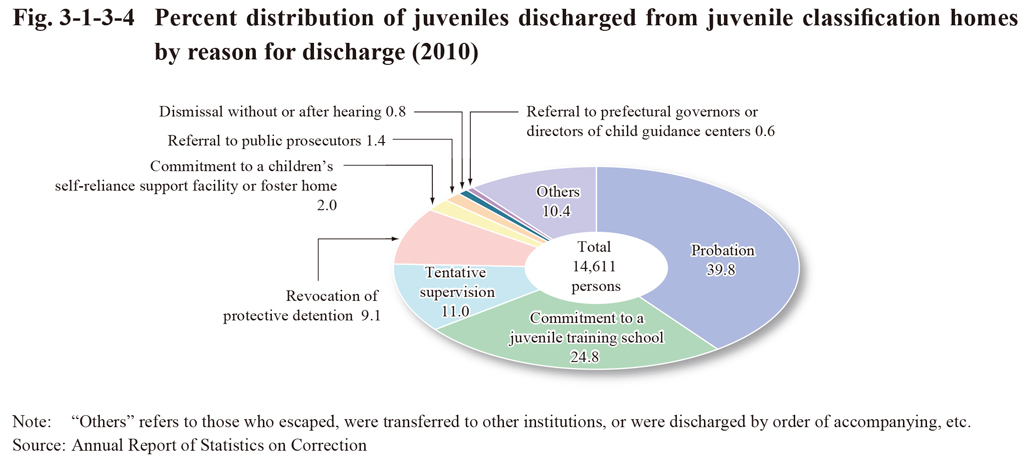
Fig. 3-1-3-4 shows the percent distribution of juveniles discharged from juvenile classification homes by the reason for their discharge in 2010.
Fig. 3-1-3-4 Percent distribution of juveniles discharged from juvenile classification homes by reason for discharge (2010)