Section 2 Disposition of Juvenile Cases at Public Prosecutors Offices/Courts
1 Public prosecutors offices (until referral to a family court)
(1) Suspects received
In 2010 the number of juvenile offenders newly received by public prosecutors was 147,408 (juvenile rate of 9.4%), that for penal code offenses 119,079 (11.8% (id.)), and that for special act offenses 28,329 (5.1% (id.)). By type of penal code offense, non-traffic penal code offenses accounted for 95,543 (31.1% (id.)) and negligence in vehicle driving causing death or injury, etc. 23,536 (3.3% (id.)), while special act offenses excluding violations of road traffic related acts totaled 2,933 (2.8% (id.)) (Source: Annual Report of Statistics on Prosecution).
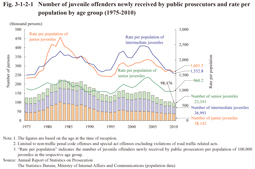
Fig. 3-1-2-1 shows the number of juvenile offenders received (limited to non-traffic penal code offenses and special act offenses excluding violations of road traffic related acts) and the rate per population by age group from 1975. Intermediate juveniles were the largest/highest in number and rate per population between 1990 and 2008, but with junior juveniles then accounting for the majority from 2009.
Fig. 3-1-2-1 Number of juvenile offenders newly received by public prosecutors and rate per population by age group (1975-2010)
Examining the percent distribution of juvenile offenders newly received by public prosecutors in 2010 by age group and type of offense revealed that junior juveniles were the largest in number for injury, intermediate juveniles for extortion, and senior juveniles for negligence in vehicle driving causing death or injury, etc., violations of road traffic related acts, and Stimulants Control Act violations. In addition, junior juveniles and intermediate juveniles were of a high proportion for theft and intermediate juveniles and senior juveniles for robbery and homicide (See Appendix 3-1).
(2) Referral to family courts
Public prosecutors can attach opinions to dispositions they consider the most appropriate when referring juvenile cases to family courts (See Appendix 3-2).
