PART 1 Crime Trends in 2010
Chapter 1 Penal Code Offenses
Section 1 Principal Data
The principal data on penal code offenses in 2010 is as follows.
| Principal data on penal code offenses, 2010 | |||||
|---|---|---|---|---|---|
| (Change from the previous year) | [Change from 1991] | ||||
| Note: With respect to negligence in vehicle driving causing death or injury, etc., the number of cleared cases is substituted for the number of reported cases. Source: Criminal Statistics by National Police Agency The Statistics Bureau, Ministry of Internal Affairs and Communications (population data) |
|||||
| [1] Reported cases | |||||
| Penal code offenses | 2,271,309 | (-128,393, | -5.4%) | [-0.6%] | |
| Non-traffic penal code offenses (included) | 1,586,189 | (-117,180, | -6.9%) | [-7.1%] | |
| Non-traffic penal code offenses excluding theft (included) | 372,747 | (-31,328, | -7.8%) | [+83.1%] | |
| Negligence in vehicle driving causing death or injury, etc. (included) | 685,120 | (-11,213, | -1.6%) | [+18.8%] | |
| [2] Cleared cases | |||||
| Penal code offenses | 1,182,809 | (-58,548, | -4.7%) | [-3.9%] | |
| Non-traffic penal code offenses (included) | 497,689 | (-47,335, | -8.7%) | [-24.0%] | |
| Non-traffic penal code offenses excluding theft (included) | 169,903 | (-13,152, | -7.2%) | [+5.8%] | |
| [3] Persons cleared | |||||
| Penal code offenses | 1,023,537 | (-28,301, | -2.7%) | [+13.8%] | |
| Non-traffic penal code offenses (included) | 322,956 | (-10,249, | -3.1%) | [+9.0%] | |
| Non-traffic penal code offenses excluding theft (included) | 147,742 | (-9,640, | -6.1%) | [+17.1%] | |
| Negligence in vehicle driving causing death or injury, etc. (included) | 700,581 | (-18,052, | -2.5%) | [+16.2%] | |
| [4] Crime rate | |||||
| Penal code offenses | 1,773.7 | (-108.3 points) | [-67.1 points] | ||
| Non-traffic penal code offenses | 1,238.7 | (-97.2 points) | [-137.5 points] | ||
| Non-traffic penal code offenses excluding theft | 291.1 | (-25.8 points) | [+127.0 points] | ||
| Negligence in vehicle driving causing death or injury, etc. | 535.0 | (-11.1 points) | [+70.5 points] | ||
| [5] Clearance rate | |||||
| Penal code offenses | 52.1% | (+0.3 points) | [-1.8 points] | ||
| Non-traffic penal code offenses | 31.4% | (-0.6 points) | [-6.9 points] | ||
| Non-traffic penal code offenses excluding theft | 45.6% | (+0.3 points) | [-33.3 points] | ||
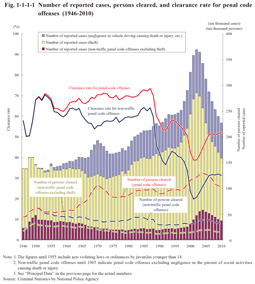
Fig. 1-1-1-1 shows the number of reported cases, number of persons cleared, and clearance rate for penal code offenses since 1946 (See Appendix 1-1).
Fig. 1-1-1-1 Number of reported cases, persons cleared, and clearance rate for penal code offenses (1946-2010)
