| Previous Next Index Image Index Year Selection | |
|
|
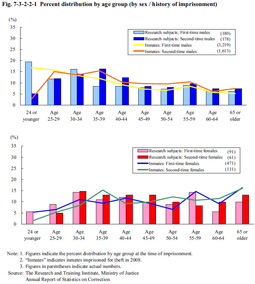
2 Persons imprisoned for theft (1) Percent distribution of research subjects by age group at the time of imprisonmentFig. 7-3-2-2-1 shows the percent distribution of the research subjects imprisoned for theft by age group and by sex and history of imprisonment. Of 510 total research subjects, males accounted for 70.2% and females for 29.8%, first-time inmates accounted for 53.1% and second-time inmates 46.9%. The average age at the time of imprisonment was 40 among first-time male inmates, 43 among second-time male inmates, 45 among first-time female inmates, and 48 among second-time female inmates. The age distribution was basically consistent with that of persons imprisoned for theft in 2008. Fig. 7-3-2-2-1 Percent distribution by age group (by sex / history of imprisonment)
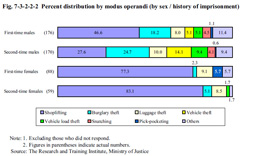
a. Modus operandi Fig. 7-3-2-2-2 shows the percent distribution of research subjects by modus operandi of cases pertaining to imprisonment (refers to cases pertaining to the second imprisonment for second-time inmates; hereinafter referred to as the “index offenses” in this section) by sex and history of imprisonment. Among males, nearly half the first-time inmates were imprisoned for shoplifting, followed by burglary theft, and then luggage theft, while less than 30% of second-time inmates were in for shoplifting, and nearly the same percentage for burglary theft, with the percentages for vehicle theft and theft from vehicles also being high. Among females, however, shoplifting accounted for about 80% of both first-time and second-time inmates. Fig. 7-3-2-2-2 Percent distribution by modus operandi (by sex / history of imprisonment)
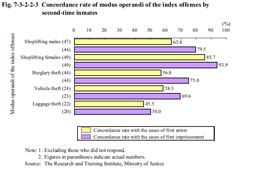
Fig. 7-3-2-2-3 Concordance rate of modus operandi of the index offenses by second-time inmates
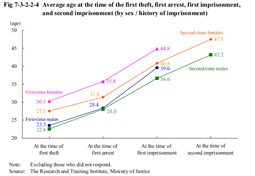
In addition, the rate of concordance with the cases of first imprisonment was higher than that of first arrest for all modus operandi, thus indicating that modus operandi tended to become set gradually. As described above the modus operandi involved in theft varies, particularly between males and females. In some cases therefore the analysis needed to be carried out by reference to sex / modus operandi in order to examine the actual conditions of the theft cases. The following analysis was therefore carried out by reference to sex/modus operandi as necessary. Meanwhile, the results of intelligence tests at the time of imprisonment for shoplifting offenders proved low when compared with those of other modus operandi for males (average IQ equivalent values: 75 for shoplifting, 83 for others) and the rate of persons with some kind of mental disorder was higher for shoplifting than for any other modus operandi both for males and females (males: 6.2% for shoplifting, 1.9% for others, females: 20.5% for shoplifting, 13.3% for others). b. Details of progression from the first theft to imprisonment for the index offenses Fig. 7-3-2-2-4 shows the average age at first theft (refers to the first experience of theft, including cases not detected), first arrest, and first and second imprisonments of inmates by sex and history of imprisonment. By sex the average age of males was generally lower than females. In addition, second-time female inmates were always 3 to 4 years younger than first-time female inmates at each observation point. Fig 7-3-2-2-4 Average age at the time of the first theft, first arrest, first imprisonment, and second imprisonment (by sex / history of imprisonment)
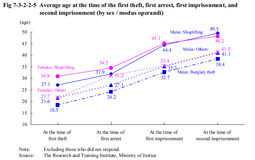
The average age of shoplifting offenders was generally higher than for other offenses both for males and females, with the average age of male burglary theft offenders being consistently lower. Fig 7-3-2-2-5 Average age at the time of the first theft, first arrest, first imprisonment, and second imprisonment (by sex / modus operandi)
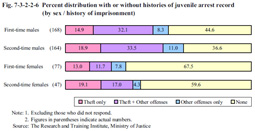
Fig. 7-3-2-2-6 shows the percent distribution of persons both with and without histories of juvenile arrest record by sex and history of imprisonment. About 60% of males had histories of juvenile arrest record and about half had of juvenile arrest record for theft. Among females more than 30% had histories of juvenile arrest record. In addition, comparing first-time inmates and second-time inmates revealed the rate of persons with histories of juvenile arrest record to be high for both male and female second-time inmates. Fig. 7-3-2-2-6 Percent distribution with or without histories of juvenile arrest record (by sex / history of imprisonment)
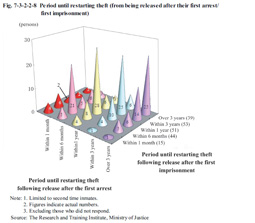
The severity in criminal tendencies of theft inmates is examined here by limiting the focus to second-time inmates. Fig. 7-3-2-2-7 shows the relationship between the frequencies of theft at the time of the index offenses and that at the time of first arrest, while Fig. 7-3-2-2-8 shows the relationship between the period between being released after first imprisonment and restarting theft and the period between being released after first arrest and repeating theft. Although there is variation among the frequencies of theft at the time of the index offenses and the period between being released after their first imprisonment and restarting theft, the frequencies of theft at the time of the index offenses was mostly at about the same level as that of the first arrests. The period until restarting theft following release after the first imprisonment was also basically at the same level as that after the first arrest. Fig. 7-3-2-2-7 Frequency of theft (at first arrest / index offenses)
Fig. 7-3-2-2-8 Period until restarting theft (from being released after their first arrest / first imprisonment)
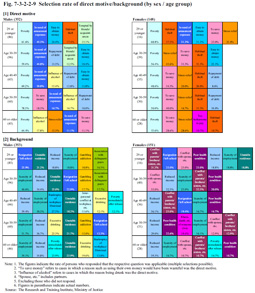
Fig. 7-3-2-2-9 shows the selection rate (refers to persons who answered as being applicable to the respective questions, with the rate of persons answering “poverty,” “scarcity of employment,” etc. as being the direct motive or background; hereinafter the same in this section) of the direct motive and background for theft of the index offenses by sex/age group (only high selection rate items are shown). The selection rate of “poverty” as a direct motive was the highest for both males and females, regardless of age. This was then followed by “in need of amusement expenses” for males. With females the selection rate of “to save money,” “stress relief,” and “habitual theft” was relatively high across all age groups. In addition, “easy to obtain money” in the relatively young age groups and “repayment of debt” in the middle age groups ranked high with both males and females. Furthermore, “tempted by friends/acquaintances” ranked high in the under-40 age group for males, while the “influence of alcohol” and “to save money” then replaced it and ranked higher as the age of the group rose. The background of the offense differed significantly between males and females. For males the selection rate of employment/income problems and unstable residence that then led to poverty was high. In addition, items indicating chaotic lifestyle such as “gambling addiction,” “excessive drinking,” and “association with delinquent peers,” etc. all also ranked high. For females, however, the selection rate of having conflict with families (including partners) was high, at the same level as income problems, with “poor health condition” also ranking high. Fig. 7-3-2-2-9 Selection rate of direct motive/background (by sex / age group)
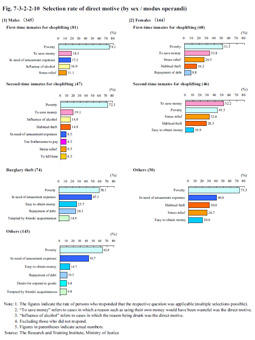
For shoplifting, the selection rate of “to save money” was high and “poverty” was most prevalent in general. However, the selection rate of “to save money” was higher than “poverty” among second-time female inmates. For shoplifting among males, the “influence of alcohol” ranked high (furthermore, by type of stolen goods the rate of “liquor” was high for shoplifting among males at 22.7%). In addition, the selection rate of “habitual theft” was high among second-time inmates (14.9% for males, 28.3% for females). For theft other than shoplifting, among males the selection rate of “in need of amusement expenses” was quite high; unlike shoplifting, “easy to obtain money,” “repayment of debt,” and “tempted by friends/acquaintances” also ranked high. Fig. 7-3-2-2-10 Selection rate of direct motive (by sex / modus operandi)
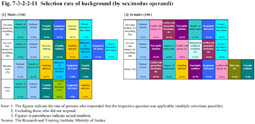
For males, following employment/income problems and unstable residences, alcohol problems ranked high as the background for shoplifting, and gambling addictions and associations with delinquent peers as background for modus operandi other than shoplifting. Females displayed slightly different tendencies for shoplifting as compared with modus operandi other than shoplifting, with gambling addictions and illicit drug use, etc. ranking high in non-shoplifting cases. Fig. 7-3-2-2-11 Selection rate of background (by sex/modus operandi)
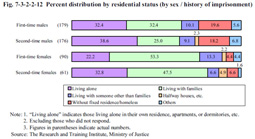
Fig. 7-3-2-2-12 shows the percent distribution of inmates by residential status at the time of the index offenses and by sex and history of imprisonment. For males the percentage of persons living alone in their own residence, etc. was the highest at over 30%, while nearly 20% were without fixed residences/homeless (the percentage of persons without fixed residences/homeless in burglary theft cases was about 8%, but apart from this no other significant difference could be observed on the basis of modus operandi). Among females, however, the proportion of persons living with their families was the highest at about 50%. In addition, the proportion of second-time inmates living with their families was low when compared to first-time inmates for both males and females, with the proportion of second-time inmates living alone in their own residence, etc. being high. Fig. 7-3-2-2-12 Percent distribution by residential status (by sex / history of imprisonment)
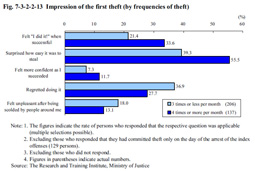
The frequency of theft and the period until restarting theft represent a severity in the criminal tendencies of theft offenders. In addition to history of imprisonment the research subjects were categorized into two groups according to the frequency of the theft at the time of the index offenses and the period until restarting theft before the index offenses (the categories for the frequencies being three times or less per month and four times or more per month; the categories for the repeat period being one year or less and more than one year). The answers from the research subjects about their attitudes toward theft and self-image were then analyzed by reference to these categories. a. Impressions of first theft Fig. 7-3-2-2-13 shows the selection rate of impression of the first theft among the research subjects, categorized by the frequency of the theft at the time of the index offenses. Among the groups with high frequencies of theft, the rate of those who had the impression of “felt ‘I did it!’ when successful” and “surprised how easy it was to steal” at the time of their first theft was high, while the rate of those who “regretted doing it” and “felt unpleasant after being scolded by people around me” was low. Those who regarded a theft as a successful experience at the time of their first theft tended to have advanced their criminal tendencies subsequently. Fig. 7-3-2-2-13 Impression of the first theft (by frequencies of theft)
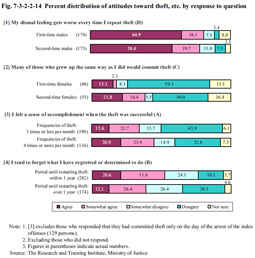
Attitudes toward theft and self-image, etc. were examined by reference to history of imprisonment, frequency of theft at the time of the index offenses, and period until restarting theft. This revealed remarkable variation in responses to some of the question statements. These statements included: A “I felt a sense of accomplishment when the theft was successful,” “I am fond of feeling the thrill of theft” (meaning they felt a positive feeling such as pleasure in regard to the theft) B “I tend to forget what I have regretted or determined to do,” “I tend to have my attention directed to what is in front of me and not be able to turn my attention to what could result from it” (meaning to have weak self-control) C “Many of those who grew up the same way as I did would commit theft,” “there are many temptations for theft in this world” (meaning to have a tendency to shift the responsibility to others) D “My dismal feeling gets worse every time I repeat theft,” “when I steal, I sometimes think about my victims and feel that I really should stop stealing” (meaning to have a feeling of resistance) (In addition to these statements, there were other corresponding statements that revealed similar variation in responses.) The variations in responses to statements within the above-mentioned group of research subjects are described below. Of these, Fig. 7-3-2-2-14 shows an example of the group of research subjects and question statements. First, with regard to history of imprisonment, the rate of male first-time inmates who answered “agree” or “somewhat agree” (hereinafter these answers are referred to as “positive responses” in this section) to statement D (having a feeling of resistance) was rather high, and the rate of female second-time inmates who gave positive responses to statements A (positive feeling) and C (shifting the responsibility) was also quite high. In terms of frequency of theft, the rate of persons who gave positive responses to statement C (shifting the responsibility) was high for the high frequency group, while the rate of persons who gave positive responses to statement D (having a feeling of resistance) was high for the low frequency group. In addition, the rate of persons who gave positive responses to statement A (positive feeling) was rather high for the high frequency group. In terms of the period until restarting theft, the rate of persons who gave positive responses to statements A (positive feeling) and B (weak self-control) was high for the short period group, while the rate of persons who gave positive responses to statement D (having a feeling of resistance) was rather high for the long period group. Fig. 7-3-2-2-14 Percent distribution of attitudes toward theft, etc. by response to question
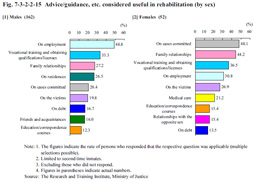
Fig. 7-3-2-2-15 shows, the selection rate in descending order (top nine items) of responses concerning advice/guidance, etc. that may have been useful if available at the time of first imprisonment. The data are limited to second-time inmates only, and divided into males and females. The selection rate of advice/guidance on employment (48.8% of males, 30.8% of females), on cases committed (20.4% of males, 48.1% of females), family relationships (27.2% of males, 44.2% of females), and vocational training and obtaining qualifications/licenses (33.3% of males, 36.5% of females) was high, while the selection rate of “on the victims” (19.8% of males, 26.9% of females) also ranked high for both males and females. In addition, advice/guidance on residences (26.5%) and relationships with friends/acquaintances (16.0%) with males and medical care (21.2%) and relationships with the opposite sex (15.4%) for females also ranked high. Fig. 7-3-2-2-15 Advice/guidance, etc. considered useful in rehabilitation (by sex)
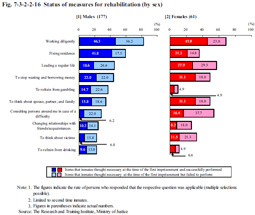
The rate of persons who considered “working diligently” necessary in rehabilitation was the highest for both males and females. More than half of the respondents stated that they were successful, but quite a few still answered that they had failed. In addition to this, the rate of persons who considered a “fixing residence,” “leading a regular life,” and “to stop wasting and borrowing money” to be necessary was also high. The number of these respondents who answered that they had failed in “leading a regular life” was higher than those who answered that they had been successful. In addition, for females the rate of persons who considered “consulting persons around me in case of a difficulty” necessary was significantly high, whereas the rate of those who answered that they had been successful was significantly low. Fig. 7-3-2-2-16 Status of measures for rehabilitation (by sex)
As described at the beginning of this chapter, theft offenders tend to repeat offenses of the same type. Viewed by modus operandi for theft, those who commit shoplifting tend to repeat offenses of the same type. The results also indicate that the modus operandi tends to become gradually set as the offenses are repeated. The average age at each stage from the first theft to that led to imprisonment is particularly lower for the second-time females than first-time females, and those who started theft at a younger age tended to be more likely to repeat offenses (be reimprisoned). These trends were not observed to such a degree with males. In addition, for both males and females, the rate of persons with histories of juvenile arrest record was higher among second-time inmates than first-time inmates, while those who had committed delinquencies as juveniles tended to have a higher risk of repeat offenses. Furthermore, in a similar comparison of first-time inmates against second-time inmates, it was observed that living alone was a factor that increased the risk of repeat offenses. The frequencies at the time of the first arrest and the length of the period until restarting theft tended to remain at about the same level. Poverty was the most common motive for theft, followed by in need of amusement expenses for males, and to save money and habitual theft for females. It is obvious that securing employment is important in order to prevent repeat offenses. Moreover, in order to raise the motivation of current inmates and released inmates to rehabilitate themselves, effective guidance on attitudes toward life needs to be provided with due consideration for their motive and background of offenses. |