| Previous Next Index Image Index Year Selection | |
|
|
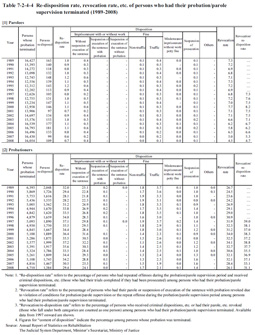
2 Re-disposition, etc. of probationers/parolees Table 7-2-4-4 shows the re-disposition rate / revocation rate, etc. of probationers/parolees (limited to those who had their probation/parole supervision terminated in the respective year) over the last 20 years.In this subsection the re-disposition rate refers to the percentage of persons who, during their probation/parole supervision period, repeated offenses and received a criminal disposition, etc. (those who had their trials completed in case of the offenders being prosecuted) among persons who had their probation/parole supervision terminated. The revocation rate refers to the percentage of persons who had their parole or suspension of execution of the sentence with probation revoked due to violation of their conditions for probation/parole supervision or repeat offenses during the probation/parole supervision period among persons who had their probation/parole supervision terminated. The revocation/re-disposition rate refers to the percentage of persons who had received a criminal disposition, etc. or had their parole, etc. revoked (those falling into both categories are counted as a single person) among persons who had their probation/parole supervision terminated. As will be described later, the re-disposition rate of parolees was extremely low, The primary reason is that although parolees who repeat offenses during the parole supervision period are subjected to criminal trials in most cases, many such trials have not been completed before the end of the parole supervision period, because that period is short. If parolees do repeat offenses during their parole supervision period, however, they are likely to have their parole revoked for violation of conditions of supervision. Therefore the revocation rate also needs to be examined before the actual situation concerning repeat offenses by parolees can be fully understood. In this subsection, therefore, the revocation rate and revocation/re-disposition rate are both examined. The re-disposition rate has remained at around 1% among parolees over the last 20 years, although over the last few years it has tended to decrease. For probationers, the rate has ranged between around 30% and the high 30s%. The revocation rate among parolees remained between the high 6% and 8% until 2003 but then decreased to the low 65% in 2004, and was 4.5% in 2008. For probationers, it remained above 30% from 1996 but then decreased to the high 20s% in 2007 and 2008. Table 7-2-4-4 Re-disposition rate, revocation rate, etc. of persons who had their probation/parole supervision terminated (1989–2008)
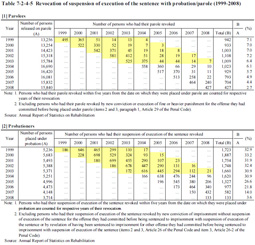
Among those placed under probation/parole supervision between 1999 and 2003, the percentage of those who had their parole revoked within five years from the date on which they were placed under parole was around 7%, while the percentage of those who had their suspension of execution of the sentence with probation revoked was over 30%. Table 7-2-4-5 Revocation of suspension of execution of the sentence with probation/parole (1999–2008)
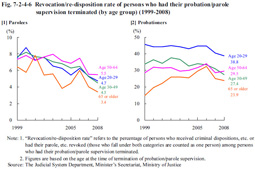
Since 2003, the highest revocation/re-disposition rate has been among parolees aged 50 to 64. The revocation/re-disposition rate of probationers aged 20 to 29 has consistently been the highest, with 38.8% of them having been either re-disposed or had their probation revoked in 2008. In addition, the revocation/re-disposition rate of parolees is basically on a decreasing trend. The revocation/re-disposition rate of elderly probationers aged 65 or older, however, has been on a significant increasing trend, rising by 9.2 points between 1999 and 2008, despite some fluctuation from year to year. Fig. 7-2-4-6 Revocation/re-disposition rate of persons who had their probation/parole supervision terminated (by age group) (1999–2008)
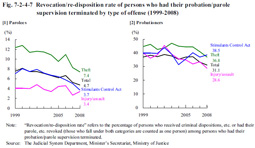
Among parolees, the revocation/re-disposition rate was the highest for theft, and also relatively high for Stimulants Control Act violations and theft among probationers. Fig. 7-2-4-7 Revocation/re-disposition rate of persons who had their probation/parole supervision terminated by type of offense (1999–2008)
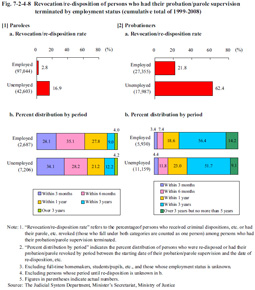
The revocation/re-disposition rate of unemployed persons far exceeded that of employed persons, both for parolees and probationers. In addition, the proportion of unemployed persons who had been re-disposed, etc. within six months was high when compared to employed parolees while the proportion of unemployed persons who had been re-disposed, etc. within three years was high when compared with employed probationers. Fig. 7-2-4-8 Revocation/re-disposition of persons who had their probation/parole supervision terminated by employment status (cumulative total of 1999–2008)
|