| Previous Next Index Image Index Year Selection | |
|
|
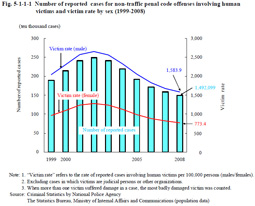
The number of reported cases and the victim rate have both continued to decline since 2003. The victim rate was higher among males than females and was over two times that of females in 2008. Fig. 5-1-1-1 Number of reported cases for non-traffic penal code offenses involving human victims and victim rate by sex (1999–2008)
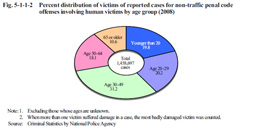
The proportion of those 65 or older has increased from 8.9% in 1999 to 10.6% in 2008 (Source: Criminal Statistics by National Police Agency). Fig. 5-1-1-2 Percent distribution of victims of reported cases for non-traffic penal code offenses involving human victims by age group (2008)
|