| Previous Next Index Image Index Year Selection | |
|
|
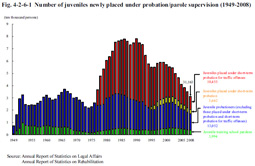
1 Juvenile probationers/parolees (1) Number of juveniles newly placed under probation/parole supervisionFig. 4-2-6-1 shows the number of juveniles newly placed under probation/parole supervision since 1949. The number reached a record high of 78,112 in 1990, but decreased from 1991 to 1995. It then increased slightly from 1996 to 1999, but started decreasing again since 2000 (See Appendix 2-12). Of juveniles newly placed under probation/parole supervision in 2008, 27,169 (down 3,385 or 11.1% from the previous year) were juvenile probationers and 3,994 (down 350 or 8.1% (id.)) were juvenile training school parolees. Fig. 4-2-6-1 Number of juveniles newly placed under probation/parole supervision (1949–2008)
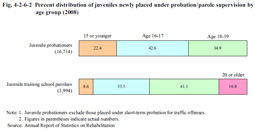
a. Age Fig. 4-2-6-2 shows the percent distribution of juvenile probationers (excluding those placed under short-term probation for traffic offenses; hereinafter the same in this section) and juvenile training school parolees newly placed under probation/parole supervision in 2008, by age group. The proportion of younger-aged individuals was higher for juvenile probationers than for juvenile training school parolees. Fig. 4-2-6-2 Percent distribution of juveniles newly placed under probation/parole supervision by age group (2008)
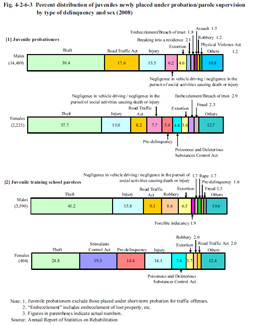
Fig. 4-2-6-3 shows the percent distribution of juveniles newly placed under probation/parole supervision in 2008, by type of delinquency and sex. Fig. 4-2-6-3 Percent distribution of juveniles newly placed under probation/parole supervision by type of delinquency and sex (2008)
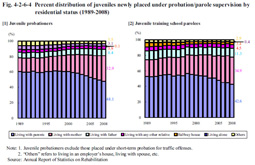
Fig. 4-2-6-4 shows the percent distribution of juveniles newly placed under probation/parole supervision by residential status over the last 20 years. The proportion “living with parents” has been decreasing, while that of “living with mother” increasing for both juvenile probationers and juvenile training school parolees. Fig. 4-2-6-4 Percent distribution of juveniles newly placed under probation/parole supervision by residential status (1989–2008)
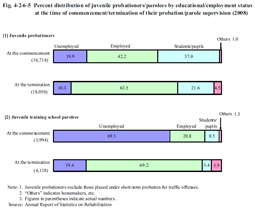
Fig. 4-2-6-5 shows the percent distribution of juvenile probationers and juvenile training school parolees by educational/employment status at the time of commencement/termination of probation/parole supervision in 2008. Although not purely speaking an exact comparison as those whose probation/parole supervision started and those whose probation/parole supervision terminated the same year were not necessarily the same person, the proportion of those employed was higher at the time of termination of probation/parole supervision than at the time of commencement for both juvenile probationers and juvenile training school parolees. However, 10.3% of all juvenile probationers and 19.4% of all juvenile training school parolees were unemployed when their probation/parole supervision terminated. Fig. 4-2-6-5 Percent distribution of juvenile probationers/parolees by educational/employment status at the time of commencement/termination of their probation/parole supervision (2008)
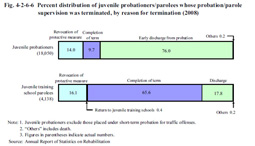
Fig. 4-2-6-6 shows the percent distribution of juvenile probationers and juvenile training school parolees whose probation/parole supervision was terminated in 2008 by reason for termination. The proportion of juvenile probationers who were granted early discharge from probation has remained around between 68 and 77% over the last 20 years and was 76.0% in 2008. The proportion of juvenile training school parolees who were granted early discharge from parole supervision (parole supervision terminated early by a decision made by a Regional Parole Board upon a request from the director of a probation office) has been around between 16 and 22% and the proportion of those who completed the term has been around between 62 and 66% over the last 20 years, and were 17.8% and 65.6% respectively in 2008. The proportion of those who received re-commitment (returned to a juvenile training school in a decision made by a family court in response to an application by a Regional Parole Board upon a proposal from the director of a probation office) or revocation of protective measures (protective measures revoked because of being placed under new treatment due to having repeated delinquencies or offenses) has been around between 13 and 20% and was 16.4% in 2008 (Source: Annual Report of Statistics on Rehabilitation). Fig. 4-2-6-6 Percent distribution of juvenile probationers/parolees whose probation/parole supervision was terminated, by reason for termination (2008)
|