| Previous Next Index Image Index Year Selection | |
|
|
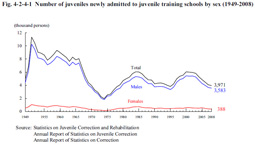
1 Juveniles newly admitted to juvenile training schools (1) Number of juveniles newly admitted to juvenile training schoolsFig. 4-2-4-1 shows the number of juveniles newly admitted to juvenile training schools (refer to juveniles newly admitted to juvenile training schools by a decision of commitment to a juvenile training school, and the equivalent of the “newly admitted juveniles in juvenile training schools” in the Annual Report of Statistics on Correction; hereinafter the same in this section and Section 7) by sex since 1949. The number of juveniles newly admitted to juvenile training schools has fluctuated after reaching a post WWII low in 1974 at 1,969. During the last 10 years the number reached a peak in 2000 at 6,052, but then continued to decrease (See Appendix 4-12). Fig. 4-2-4-1 Number of juveniles newly admitted to juvenile training schools by sex (1949–2008)
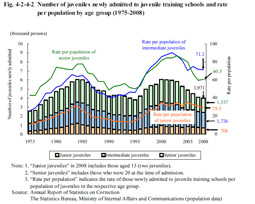
a. Age Fig. 4-2-4-2 shows the number of juveniles newly admitted to juvenile training schools and rate per population by age group since 1975. Examining the number of juveniles newly admitted to juvenile training schools over the last 10 years revealed that the number of junior juveniles reached a peak in 2000 at 999 but has been on a slight decreasing trend with some slight ups and downs since then; that of intermediate juveniles and senior juveniles both reached a peak in 2001 at 2,583 and 2,560 respectively, but have since been on a decreasing trend. Comparing the rate per population of the respective age groups in 2008 (the number of juveniles newly admitted to juvenile training schools was 3,971) with that in 1978 (3,779 (id.)) and 1995 (3,828 (id.)) when the number of juvenile inmates was basically at the same level revealed that the rate per population was remarkably high among all ages in 2008 (that in 1978, 1995, and 2008 of junior juveniles was 15.5, 14.9, 29.5, intermediate juveniles 45.1, 46.1, 71.2, and senior juveniles 57.1, 50.4, 60.5, respectively). Only two juveniles younger than 14 were newly admitted to juvenile training schools (both males). Fig. 4-2-4-2 Number of juveniles newly admitted to juvenile training schools and rate per population by age group (1975–2008)
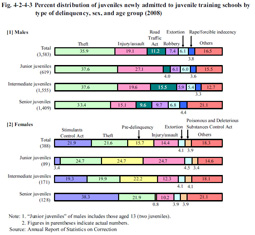
Fig. 4-2-4-3 shows the percent distribution of juveniles newly admitted to juvenile training schools by type of delinquency, sex, and age group in 2008. Fig. 4-2-4-3 Percent distribution of juveniles newly admitted to juvenile training schools by type of delinquency, sex, and age group (2008)
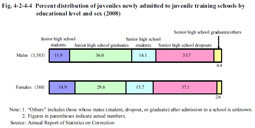
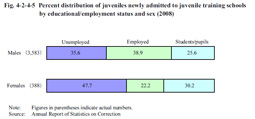
c. Educational level and educational/employment status Fig. 4-2-4-4 shows the percent distribution of juveniles at juvenile training schools in 2008 by educational level and sex, while Fig. 4-2-4-5 shows the same by educational/employment status and sex. By educational level, the proportion of junior high school graduates and senior high school dropouts was high among both males and females. By educational/employment status, the proportion of unemployed and students/pupils was higher for females than males. Fig. 4-2-4-4 Percent distribution of juveniles newly admitted to juvenile training schools by educational level and sex (2008)
Fig. 4-2-4-5 Percent distribution of juveniles newly admitted to juvenile training schools by educational/employment status and sex (2008)
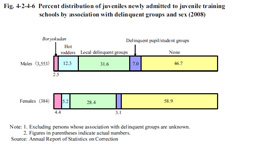
Fig. 4-2-4-6 shows the percent distribution of juveniles newly admitted to juvenile training schools in 2008 by their association with delinquent groups and sex. Among both males and females associated with delinquent groups, the proportion of those associated with local delinquent groups was the highest. The proportion of those associated with hot rodders was lower and that with Boryokudan was higher for females than males. Fig. 4-2-4-6 Percent distribution of juveniles newly admitted to juvenile training schools by association with delinquent groups and sex (2008)
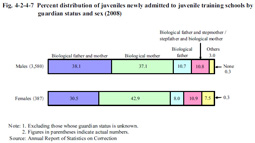
Fig. 4-2-4-7 shows the percent distribution of juveniles newly admitted to juvenile training schools in 2008 by guardian status and sex. The proportion of those whose guardians were their biological mothers has been on a rising trend over recent years, while the proportion of those whose guardians were both their biological fathers and mothers declined by 0.4 points from the previous year in 2008 (Source: Annual Report of Statistics on Correction). Fig. 4-2-4-7 Percent distribution of juveniles newly admitted to juvenile training schools by guardian status and sex (2008)
|