| Previous Next Index Image Index Year Selection | |
|
|
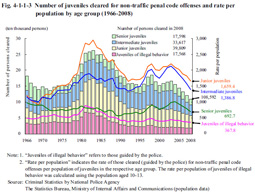
2 Trends by attribute (1) Trends by age groupa. Number of juveniles cleared and rate per population by age group Fig. 4-1-1-3 shows the number of juveniles cleared for non-traffic penal code offenses and rate per population by age group since 1966 (the rate per population of juveniles of illegal behavior was calculated using the population of those aged 10 to 13) (See Appendix 4-2). Fig. 4-1-1-3 Number of juveniles cleared for non-traffic penal code offenses and rate per population by age group (1966–2008)
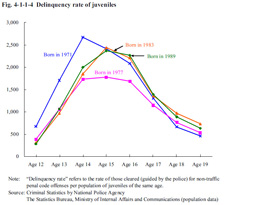
b. Delinquency rate Fig. 4-1-1-4 shows the delinquency rate (refers to the rate of those cleared (guided by the police) for non-traffic penal code offenses per population of juveniles; hereinafter the same in this subsection) among juveniles born in 1971, 1977, 1983, and 1989 (estimated) by age group of 12 to 19. This reveals how the delinquency rate changes as juvenile age does. The delinquency rate at a younger age was high for those born in 1971 when compared to those with other birth years, and the age at which the delinquency rate reached a peak was low at 14 while with other birth years it was 15. The delinquency rate at ages 15 and 16 was remarkably low for those born in 1977 when compared to those with other birth years. The delinquency rate among those born in 1983 and in 1989 have similar trends. Fig. 4-1-1-4 Delinquency rate of juveniles
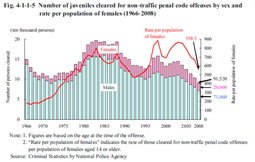
Fig. 4-1-1-5 shows the number of juveniles cleared (not including juveniles of illegal behavior guided by the police) for non-traffic penal code offenses by sex and rate per population of females (rate per female juvenile population aged 14 or older) since 1966. The rate per population of females continued decreasing every year from 2004. Fig. 4-1-1-5 Number of juveniles cleared for non-traffic penal code offenses by sex and rate per population of females (1966–2008)
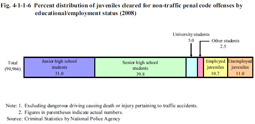
Fig. 4-1-1-6 shows the percent distribution of juveniles cleared (not including juveniles of illegal behavior guided by the police) for non-traffic penal code offenses (excluding dangerous driving causing death or injury pertaining to traffic accidents) by educational/employment status. The proportion of senior high school students was the highest, followed by junior high school students, and then unemployed juveniles. There have been no significant changes in the percent distribution over recent years. Fig. 4-1-1-6 Percent distribution of juveniles cleared for non-traffic penal code offenses by educational/employment status (2008)
|