| Previous Next Index Image Index Year Selection | |
|
|
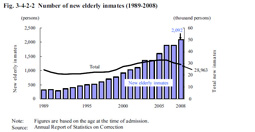
2 Correction Fig. 3-4-2-2 shows the number of elderly persons among new inmates over the last 20 years.The number has been on a basically consistent increasing trend over the last 20 years, and this increasing trend is quite remarkable as compared with the total new inmates. Fig. 3-4-2-2 Number of new elderly inmates (1989–2008)
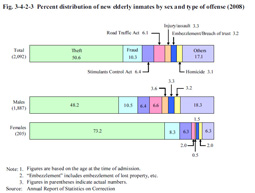
Among females and males in total, the proportion for theft was the highest at 50.6%, followed by fraud at 10.3%, Stimulants Control Act violations at 6.4%, Road Traffic Act violations at 6.1%, and injury/assault at 3.3%. Among males, the order was almost the same and the percent distribution by type of offense was also similar. Among females, the proportion for theft was especially high at 73.2%. Fig. 3-4-2-3 Percent distribution of new elderly inmates by sex and type of offense (2008)
|