| Previous Next Index Image Index Year Selection | |
|
|
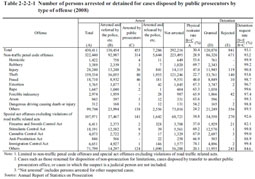
The percentage of suspects in physical restraint cases (refers to cases in which suspects who were arrested by the police, etc. and referred to public prosecutors or arrested by public prosecutors; hereinafter the same in this section) among all suspects excluding juridical persons (the custody rate) was 30.4%. In addition, the detention request rate (refers to the percentage of suspects whom public prosecutors requested to be detained among suspects in physical restraint cases) was 93.1%. Table 2-2-2-1 Number of persons arrested or detained for cases disposed by public prosecutors by type of offense (2008)
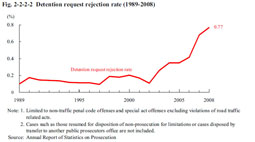
Fig. 2-2-2-2 Detention request rejection rate (1989-2008)
|