| Previous Next Index Image Index Year Selection | |
|
|
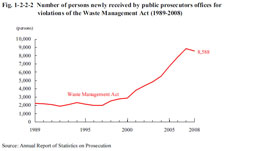
2 Violations of the Waste Management Act, etc. Fig. 1-2-2-2 shows the number of persons newly received by public prosecutors offices for violations of the Waste Management Act over the last 20 years (See Appendix 1-4).The number was consistently increasing from 1998, but was down 3.3% from the previous year in 2008. Fig. 1-2-2-2 Number of persons newly received by public prosecutors offices for violations of the Waste Management Act (1989–2008) |
