2 Work of elderly inmates
Table 7-4-1-1 shows the number and percent ratio of released inmates (on completion of sentence and on parole) in 2007 by type of work.
Table 7-4-1-1 Number of released inmates by type of work (2007)
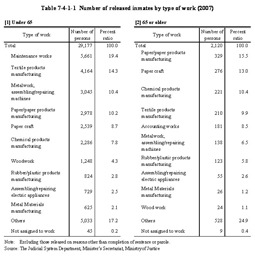
The percent ratio of maintenance works (works required in sustaining institutions, including cooking, cleaning, laundry, nursing care, haircutting, and assistance in work instruction, etc.) was the highest among inmates of under 65 years of age (hereinafter referred to as “non-elderly inmates” in this section) while paper/paper product manufacturing was the highest among elderly inmates, followed by paper craft, chemical product manufacturing, and textile product manufacturing.