| Previous Next Index Image Index Year Selection | |
|
|
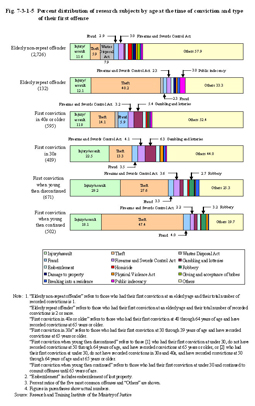
4 Characteristics of offenses by elderly offenders Fig. 7-3-1-5 Percent distribution of research subjects by age at the time of conviction and type of their first offense
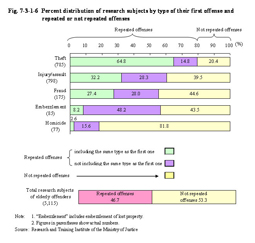
Finally, the research subjects of elderly offenders' tendency to repeat offenses by type of their first offense reveals that those who had committed theft as their first offense have the highest tendency to commit offenses of the same type (64.8%), followed by those who had committed injury/assault and fraud as their first offense (see Fig. 7-3-1-6). Overall, nearly half of them repeated offenses. The tendency to repeat offenses of the same type by age using the recorded convictions was shown above (see 3 of this section). Here the tendency to repeat offenses of the same type is discussed by type of offense. Of the research subjects of elderly offenders (5,115 persons), theft and injury/assault were the highest in actual number and tendency to repeat the same type of offense. For those whose first offenses were theft and committed another type of offense at least once (625 persons), 29.4% (184 persons) committed theft in all their repeated offenses while 52.0% (325 persons) repeated theft at least once, which confirms the high tendency to repeat theft. For those whose first offenses were injury/assault and committed another offense at least once (483 persons), 15.1% (73 persons) committed theft in all their repeated offenses while 38.1% (184 persons) repeated theft at least once. Although not as high as theft, more than the majority repeated the same type of offenses. Fig. 7-3-1-6 Percent distribution of research subjects by type of their first offense and repeated or not repeated offenses
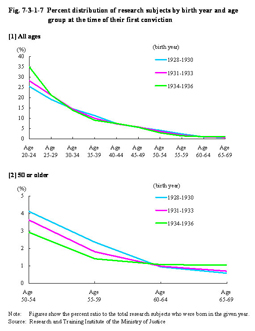
Understanding the relationship between age and criminal tendencies is important in enabling effective measures to be mapped out by targeting certain age groups for focused offense prevention. Past studies have revealed that, regardless of country or region, the offense rate per population by age (for example number of persons cleared for non-traffic penal code offenses per 100,000 persons of the same age) starts to increase in early adolescence (around 13 years old), reaches a peak around mid-adolescence (16–17 years old), and then turns to a decreasing trend. This then means that the number of persons newly committing offenses decreases and that those who have committed offenses also stop repeating offenses as they age. The following 2 cases will discussed in examining whether general trends in the offense rate per population by age matches the trends of research subjects in Japan or not. The first case is whether the rate of research subjects who committed their first offense at an elderly age decreases as they further age or not. The second case is whether those with histories of offenses before reaching an elderly age are less likely to repeat offenses (stop committing offenses) as they age or not. According to general trends in the offense rate per population by age both the two cases should have decreasing trends. With the first case, the age of research subjects at the time of their first conviction shows that [1] for those born in 1928 to 1933, the rate of persons who had their first conviction decreases with the advancement of their age, matching the above mentioned general trends in the relationship between age and criminal tendencies. However, [2] those born in 1934 to 1936 have a somewhat different trend in that [1] the rate of persons who had their first conviction decrease with the advancement of age but quite gently after 60–64 years of age (see Fig. 7-3-1-7). Fig. 7-3-1-7 Percent distribution of research subjects by birth year and age group at the time of their first conviction
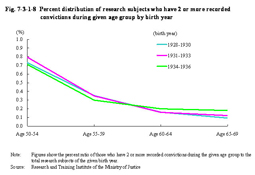
Fig. 7-3-1-8 Percent distribution of research subjects who have 2 or more recorded convictions during given age group by birth year
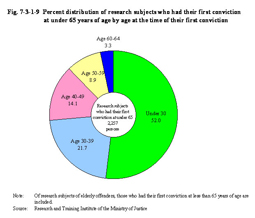
Fig. 7-3-1-9 Percent distribution of research subjects who had their first conviction at under 65 years of age by age at the time of their first conviction
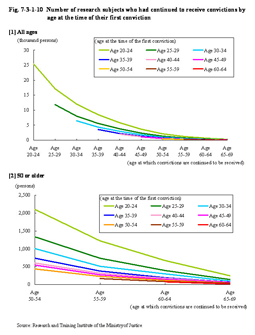
Fig. 7-3-1-10 Number of research subjects who had continued to receive convictions by age at the time of their first conviction
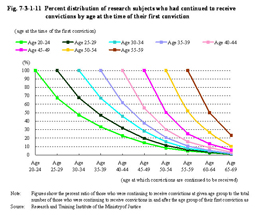
Fig. 7-3-1-11 Percent distribution of research subjects who had continued to receive convictions by age at the time of their first conviction
As described above, not simply because they were young and could commit offenses over a long period of time, it was revealed that this age group shows high criminal tendency with recorded convictions even at younger stages of their lives. Therefore, developing measures to prevent young offenders from repeating offenses could be part of preventive measures against elderly offenders. As given in Fig. 7-3-1-11, although the repeat offense continuation rate for late middle age group (50 or older) declines more rapidly over time (to about 1/4 over 10 years) than that for younger groups, there are some in that group who had obviously been repeating offenses. Although the actual number of such offenders is small (see Fig. 7-3-1-10), for those who had their first conviction in their late middle age and have a strong tendency to repeat offenses, research on causes for repeating offenses through further analysis on the type of offenses and their attributes/environment will be necessary in the future in designing effective measures. |