2 Elderly victim rate by age group
Fig. 7-2-6-2 shows the victim rate (ratio per 100,000 persons of the number of reported cases involving human victims of the subject age group) for non-traffic penal code offenses by age group and type of offense over the last 10 years.
Fig. 7-2-6-2 Victim rate for non-traffic penal code offenses by age group and type of offense (1988–2007)
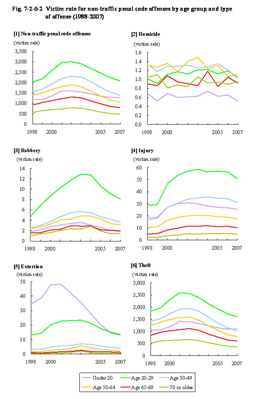
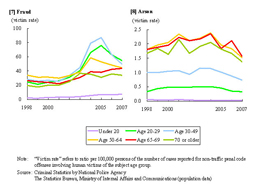
With the entire range of non-penal code offenses the victim rate has had a decreasing trend in recent years and the elderly victim rate was lower compared to other age groups. By type of offense, the elderly victim rates have generally been at a low level when compared to other age groups, but higher than the victim rate of the age group of under 50 for arson. In addition, among the victim rates of age groups of 20 or older for fraud, only the victim rate of the age group of 65 to 69 (43.8) increased from the previous year.
In regard to billing fraud (extortion) cases in 2007, the number of victims of so-called “it's me” fraud (extortion) cases was 6,329, and of which elderly accounted for 59.2%. In addition, the number of victims in refund, etc. fraud cases in the same year was 2,472, of which elderly accounted for 53.5% (Source: National Police Agency).