| Previous Next Index Image Index Year Selection | |
|
|
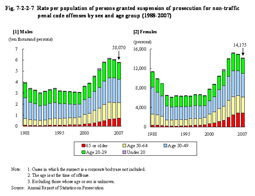
3 Suspension of prosecution Fig. 7-2-2-7 Rate per population of persons granted suspension of prosecution for non-traffic penal code offenses by sex and age group (1988–2007)
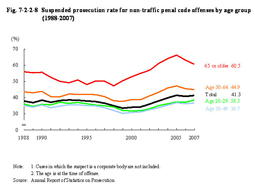
When the benchmark figure for 1988 is set to 100, The rate of increase in the number of persons granted suspension of prosecution was 103.4 for the age group of under 20, 109.5 for the age group of 20 through 29, 108.3 for the age group of 30 through 49, 203.1 for the age group of 50 through 64, and 896.7 for the age group of 65 or older. It is especially high for the elderly group, with the number of elderly granted suspension of prosecution also increasing at a significantly higher rate than the growth of the total elderly population. Fig. 7-2-2-8 shows the suspended prosecution rate for non-traffic penal code offenses by age group over the last 20 years. Fig. 7-2-2-8 Suspended prosecution rate for non-traffic penal code offenses by age group (1988–2007)
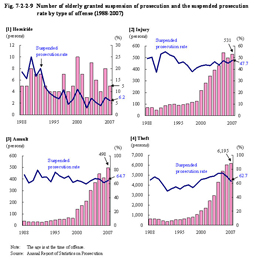
Fig. 7-2-2-9 shows the number of elderly granted suspension of prosecution and the suspended prosecution ratio for the four specific offenses of homicide, injury, assault, and theft over the last 20 years. Fig. 7-2-2-9 Number of elderly granted suspension of prosecution and the suspended prosecution rate by type of offense (1988–2007)
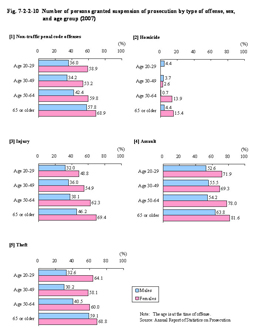
The number of elderly granted suspension of prosecution for injury and assault has had been on a significantly increasing trend since 2000. The suspended prosecution rate, however, did not change over the same period, or had increased slightly or leveled off. With theft the number of elderly granted suspension of prosecution has had been on a remarkably increasing trend in recent years and has continued increasing since 1993. The suspended prosecution rate also continued to increase from 1999, but decreased over two consecutive years from 2006. Fig. 7-2-2-10 shows the number of persons granted suspension of prosecution for non-traffic penal code offenses and the four specific offenses of homicide, injury, assault, and theft by sex and age group in 2007. Fig. 7-2-2-10 Number of persons granted suspension of prosecution by type of offense, sex, and age group (2007)
|