| Previous Next Index Image Index Year Selection | |
|
|
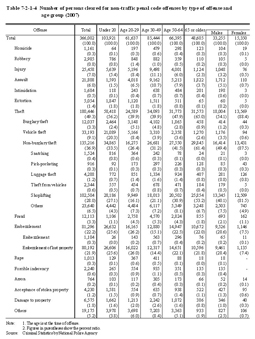
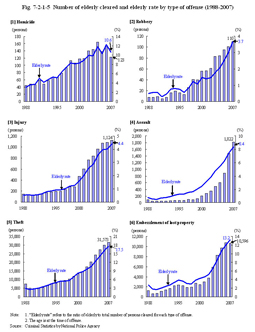
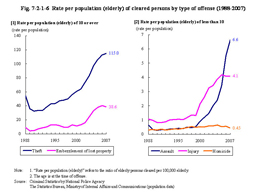
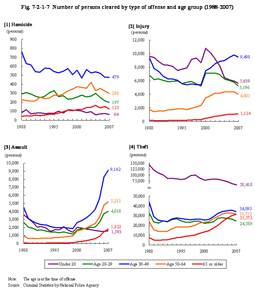
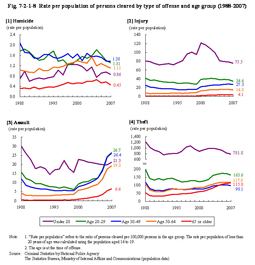
2 Trends by type of offense Table 7-2-1-4 shows the number of persons cleared for non-traffic penal code offenses by type of offense and age group in 2007. Table 7-2-1-4 Number of persons cleared for non-traffic penal code offenses by type of offense and age group (2007) In every age group the ratio of theft cases was the highest among persons cleared. Among elderly, theft cases accounted for nearly 2/3 of the total number at 65.0%, followed by embezzlement (of which 99.3% was embezzlement of lost property) at 22.0%, assault at 3.7%, and injury at 2.3%.The ratio of theft cases was noticeably high among elderly females in particular at 88.4%. The percent distribution of total theft cases, which accounted for a major part with elderly offenders, by modus operandi, reveals that shoplifting was dominantly high at 81.9% while non-burglary theft including shoplifting reached 94.5%. Shoplifting is a crime for which the ratio of females is generally high (the female rate of the number of persons cleared for shoplifting was 44.2% (see Table 1-1-1-7) and was 48.4% among elderly) and is a major factor in the increase in female rate of elderly offenders. The fact that shoplifting and embezzlement of lost property accounted for 75.0% of the number of elderly cleared for non-traffic penal code offenses shows that, in terms of the number of cases, a major part of crimes committed by elderly are relatively minor property offenses. Fig. 7-2-1-5 shows the number of elderly cleared and the elderly rate by type of offense over the last 20 years. Fig. 7-2-1-5 Number of elderly cleared and elderly rate by type of offense (1988–2007) The number of elderly cleared and the elderly rate both increased with most major offenses.Between 1988 and 2007, the number of elderly cleared for non-traffic penal code offenses increased by 38,717. Two dominant offenses among elderly, namely theft (increased by 24,088 (62.2%)) and embezzlement of lost property (increased by 9,347 (24.1%)), accounted for 86.4% of the total increase. Furthermore, a major part of the increase in theft cases was for shoplifting. The increase in number of crimes committed by elderly, however, is not only limited to such minor property offenses. The number of cleared elderly and elderly rate both increased for serious crimes that included homicide and robbery, violent offenses including injury, assault, and intimidation, property offenses such as fraud, and sexual offenses including forcible indecency. It should be noted that the elderly rate for homicide cases in particular was at a high level, next to theft and embezzlement of lost property. In addition, the increase in violent offenses is also remarkable. The elderly rate for injury cases increased from 0.5% in 1988 to 4.4% in 2007 (up by 3.9 points over 20 years) and that for assault cases increased from 0.8% in 1988 to 8.4% in 2007 (up by 7.6 points (id.)). Fig. 7-2-1-6 shows the rate per population (elderly) of cleared persons by type of offense over the last 20 years. For the four specific offenses of homicide, injury, assault, and theft, Fig. 7-2-1-7 shows the number of cleared persons by age group while Fig. 7-2-1-8 shows the rate per population of the number of cleared persons by age group over the last 20 years. Again, a significant increase can be seen in the rate per population, indicating that crimes committed by elderly increased at a higher rate than the growth of the total elderly population. Fig. 7-2-1-6 [2] reveals that the rate per population (elderly) of the number of persons cleared for homicide increased by about 2.1 times from 0.32 in 1988 to 0.66 in 2004. It then decreased but was still at the high level of 0.45 (about 1.4 times as that of 1988) in 2007. The rate per population (elderly) of the number of persons cleared for robbery increased by nearly 7 times from 0.06 in 1988 to 0.40 in 2007. The fact that the rate per population (elderly) for homicide and robbery of which dark figures are small also had an increasing trend strongly suggests that crimes committed by elderly are in general increasing. Fig. 7-2-1-6 Rate per population (elderly) of cleared persons by type of offense (1988–2007) Fig. 7-2-1-7 and Fig. 7-2-1-8 reveal that the number of cleared persons and the rate per population for age groups of under 50 either leveled off or had decreasing trends with some ups and downs over the 20 years of 1988 to 2007 while those of the elderly group (65 or older) and its reserve group (the age group of 50 to 64) both increased during the same period.Fig. 7-2-1-7 Number of persons cleared by type of offense and age group (1988–2007) Fig. 7-2-1-8 Rate per population of persons cleared by type of offense and age group (1988–2007) Trends with the increase in the number of persons for injury and the rate per population are also remarkable with elderly and its reserve group. With the elderly group the number of persons cleared and rate per population increased remarkably from 148 and 1.1 in 1998 to 1,124 (up by 976 (659.5%) over 20 years) and 4.1 (up by 3.0 points (id.), about 3.8 times that of 1988), in 2007. For the age group of 50 through 64, the increase was also remarkable from 1,773 and 8.1 in 1998 to 4,001 (up by 2,228 (125.7%) (id.)) and 14.8 (up by 6.8 points (id.), about 1.8 times that of 1988) in 2007.In recent years, the number of persons cleared for assault and the rate per population has had a decreasing trend for the age group of under 20 but a significant increasing trend with other age groups. The rate of increase tends to increase as the age of the group becomes older. With the elderly group the number of persons cleared and the rate per population increased significantly from 90 and 0.65 in 1998 to 1,822 (up by 1,732 (1,924.4%) over 20 years) and 6.6 (up by 6.0 points (id.), about 10.2 times as that of 1988) in 2007. With the age group of 50 to 64 the increase was also significant from 958 and 4.4 in 1998 to 5,213 (up by 4,255 (444.2%) (id.)) and 19.3 (up by 15.0 points (id.), about 4.4 times as that of 1988) in 2007. For theft cases the age group of under 20 dominates with the number of persons cleared, but decreased significantly over the period of 20 years of 1988 through 2007. The number of persons cleared for theft in 2007 was below the level of that in 1988 for the age groups of 20 through 29 and 30 through 49. However, in contrast, an increasing trend can be seen for the age group of 50 through 64 and the elderly group especially. The rate of increase is particularly remarkable with the elderly group. The number of cleared persons increased from 7,485 with the elderly group and 24,291 for the age group of 50 through 64 in 1988 to 31,573 (up by 24,088 (321.8%) over 20 years) and 31,773 (up by 7,482 (30.8%) (id.)) in 2007, respectively. The rate per population also increased from 54.3 for the elderly group and 110.6 for the age group of 50 through 64 in 1988 to 115.0 (up by 60.7 points (id.), about 2.1 times) and 117.9 (up by 7.2 points (id.)). There have been some turnarounds, which include the rate per population of the age group of 50 through 64 exceeding that of the age group of 30 through 49 since 1996 and that of the elderly group exceeding that of the age group of 30 through 49 since 2005. In addition, the rate per population of the elderly group is also at the same level as that of the age group of 50 through 64. |
